29
/
en
AIzaSyAYiBZKx7MnpbEhh9jyipgxe19OcubqV5w
April 1, 2024
276156
United Kingdom
GBR
true
2
1
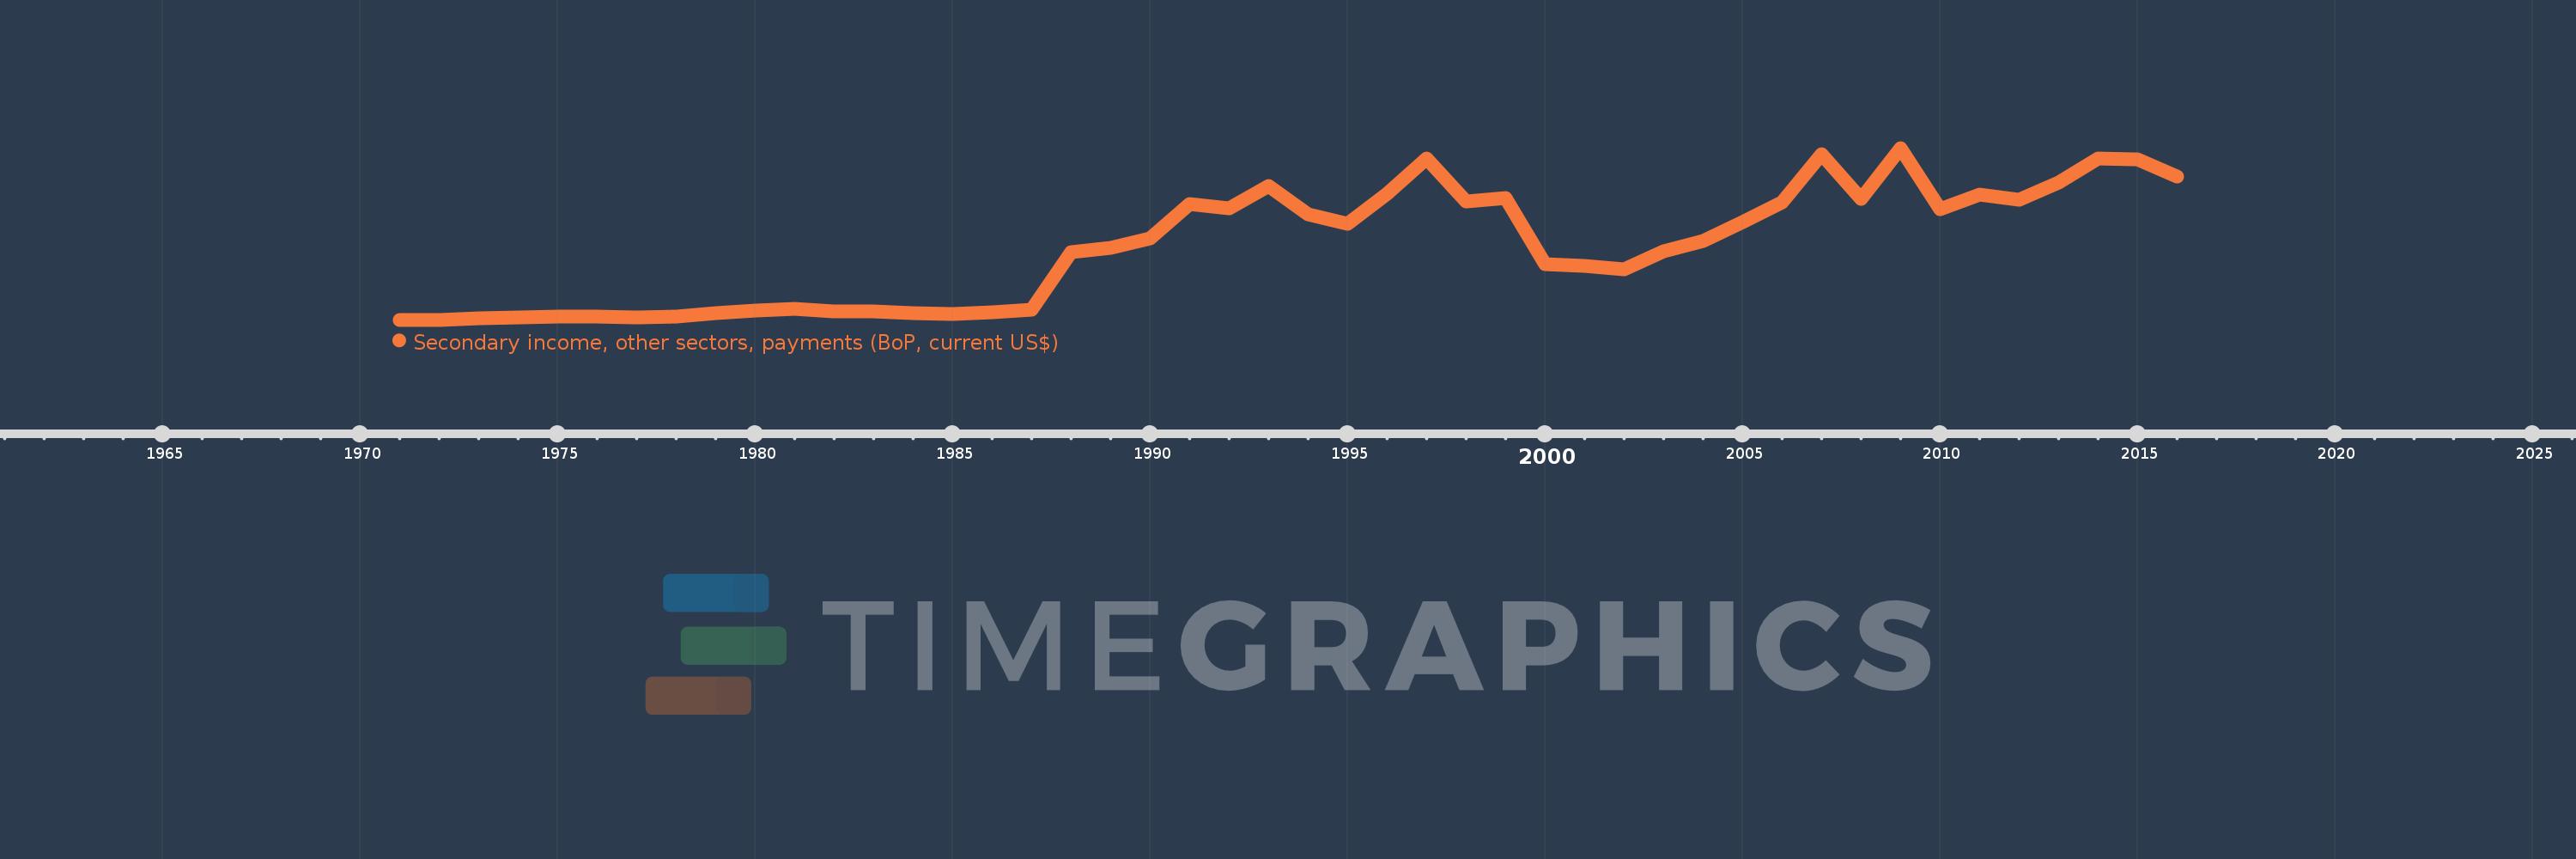
Secondary income, other sectors, payments (BoP, current US$)
2016,2015,2014,2013,2012,2011,2010,2009,2008,2007,2006,2005,2004,2003,2002,2001,2000,1999,1998,1997,1996,1995,1994,1993,1992,1991,1990,1989,1988,1987,1986,1985,1984,1983,1982,1981,1980,1979,1978,1977,1976,1975,1974,1973,1972,1971
This statistics in other country:
AfghanistanAlbaniaAlgeriaAngolaAntigua and BarbudaArab WorldArgentinaArmeniaArubaAustraliaAustriaAzerbaijanBahamas, TheBahrainBangladeshBarbadosBelarusBelgiumBelizeBeninBermudaBhutanBoliviaBosnia and HerzegovinaBotswanaBrazilBrunei DarussalamBulgariaBurkina FasoBurundiCabo VerdeCambodiaCameroonCanadaCaribbean small statesCentral African RepublicCentral Europe and the BalticsChadChileChinaColombiaComorosCongo, Dem. Rep.Congo, Rep.Costa RicaCote d'IvoireCroatiaCuracaoCyprusCzech RepublicDenmarkDjiboutiDominicaDominican RepublicEarly-demographic dividendEast Asia & PacificEast Asia & Pacific (excluding high income)East Asia & Pacific (IDA & IBRD countries)EcuadorEgypt, Arab Rep.El SalvadorEquatorial GuineaEritreaEstoniaEthiopiaEuro areaEurope & Central AsiaEurope & Central Asia (excluding high income)Europe & Central Asia (IDA & IBRD countries)European UnionFaroe IslandsFijiFinlandFragile and conflict affected situationsFranceFrench PolynesiaGabonGambia, TheGeorgiaGermanyGhanaGreeceGrenadaGuatemalaGuineaGuinea-BissauGuyanaHaitiHeavily indebted poor countries (HIPC)High incomeHondurasHong Kong SAR, ChinaHungaryIBRD onlyIcelandIDA & IBRD totalIDA blendIDA onlyIDA totalIndiaIndonesiaIran, Islamic Rep.IraqIrelandIsraelItalyJamaicaJapanJordanKazakhstanKenyaKiribatiKorea, Rep.KosovoKuwaitKyrgyz RepublicLao PDRLate-demographic dividendLatin America & Caribbean Latin America & Caribbean (excluding high income)Latin America & the Caribbean (IDA & IBRD countries)LatviaLeast developed countries: UN classificationLebanonLesothoLiberiaLibyaLithuaniaLow & middle incomeLow incomeLower middle incomeLuxembourgMacao SAR, ChinaMacedonia, FYRMadagascarMalawiMalaysiaMaldivesMaliMaltaMarshall IslandsMauritaniaMauritiusMexicoMicronesia, Fed. Sts.Middle East & North AfricaMiddle East & North Africa (excluding high income)Middle East & North Africa (IDA & IBRD countries)Middle incomeMoldovaMongoliaMontenegroMoroccoMozambiqueMyanmarNamibiaNepalNetherlandsNew CaledoniaNew ZealandNicaraguaNigerNigeriaNorth AmericaNorwayOECD membersOmanOther small statesPacific island small statesPakistanPalauPanamaPapua New GuineaParaguayPhilippinesPolandPortugalPost-demographic dividendPre-demographic dividendQatarRomaniaRussian FederationRwandaSamoaSao Tome and PrincipeSaudi ArabiaSenegalSerbiaSeychellesSierra LeoneSingaporeSint Maarten (Dutch part)Slovak RepublicSloveniaSmall statesSolomon IslandsSouth AfricaSouth AsiaSouth Asia (IDA & IBRD)South SudanSpainSri LankaSt. Kitts and NevisSt. LuciaSt. Vincent and the GrenadinesSub-Saharan Africa Sub-Saharan Africa (excluding high income)Sub-Saharan Africa (IDA & IBRD countries)SudanSurinameSwazilandSwedenSwitzerlandSyrian Arab RepublicTajikistanTanzaniaThailandTimor-LesteTogoTongaTrinidad and TobagoTunisiaTurkeyTuvaluUgandaUkraineUnited KingdomUnited StatesUpper middle incomeUruguayVanuatuVenezuela, RBVietnamWest Bank and GazaWorldYemen, Rep.ZambiaZimbabwe Timeline:
This timeline shows a graph from 1971 to 2016 of United Kingdom. No data until 1970. Number of actual observations by date: 46.
Source name:
World Development Indicators
Source organization:
International Monetary Fund, Balance of Payments Statistics Yearbook and data files.
Categories, topics:
Economy & Growth
Last updated:
apr 23, 2017
Indicators value changes by year
Minimum:
583.2 mln
jan 1, 1971
Maximum:
32.354 bln
jan 1, 2009
At the date of observation
Value
Absolute change
Change from previous value
jan 1, 1971
583.2 mln
+583.2 mln
0.0%
jan 1, 1972
601.921 mln
+18.722 mln
3.21%
jan 1, 1973
788.743 mln
+186.822 mln
31.04%
jan 1, 1974
1.028 bln
+238.769 mln
30.27%
jan 1, 1975
1.115 bln
+87.637 mln
8.53%
jan 1, 1976
1.176 bln
+61.281 mln
5.5%
jan 1, 1977
991.783 mln
-184.646 mln
-15.7%
jan 1, 1978
1.153 bln
+161.156 mln
16.25%
jan 1, 1979
1.73 bln
+576.572 mln
50.01%
jan 1, 1980
2.217 bln
+487.045 mln
28.16%
jan 1, 1981
2.65 bln
+433.073 mln
19.54%
jan 1, 1982
2.14 bln
-509.494 mln
-19.23%
jan 1, 1983
2.099 bln
-41.544 mln
-1.94%
jan 1, 1984
1.806 bln
-292.695 mln
-13.95%
jan 1, 1985
1.711 bln
-95.075 mln
-5.26%
jan 1, 1986
1.896 bln
+185.397 mln
10.84%
jan 1, 1987
2.428 bln
+532.208 mln
28.07%
jan 1, 1988
13.112 bln
+10.684 bln
439.94%
jan 1, 1989
13.917 bln
+805.236 mln
6.14%
jan 1, 1990
15.605 bln
+1.688 bln
12.13%
jan 1, 1991
21.942 bln
+6.336 bln
40.6%
jan 1, 1992
21.11 bln
-831.737 mln
-3.79%
jan 1, 1993
25.276 bln
+4.165 bln
19.73%
jan 1, 1994
20.017 bln
-5.259 bln
-20.81%
jan 1, 1995
18.4 bln
-1.617 bln
-8.08%
jan 1, 1996
23.829 bln
+5.43 bln
29.51%
jan 1, 1997
30.371 bln
+6.542 bln
27.45%
jan 1, 1998
22.479 bln
-7.892 bln
-25.99%
jan 1, 1999
23.107 bln
+628.382 mln
2.8%
jan 1, 2000
10.859 bln
-12.249 bln
-53.01%
jan 1, 2001
10.589 bln
-269.76 mln
-2.48%
jan 1, 2002
9.857 bln
-731.977 mln
-6.91%
jan 1, 2003
13.237 bln
+3.38 bln
34.29%
jan 1, 2004
15.17 bln
+1.933 bln
14.61%
jan 1, 2005
18.571 bln
+3.4 bln
22.41%
jan 1, 2006
22.362 bln
+3.791 bln
20.41%
jan 1, 2007
31.2 bln
+8.839 bln
39.53%
jan 1, 2008
22.91 bln
-8.29 bln
-26.57%
jan 1, 2009
32.354 bln
+9.444 bln
41.22%
jan 1, 2010
20.998 bln
-11.356 bln
-35.1%
jan 1, 2011
23.673 bln
+2.675 bln
12.74%
jan 1, 2012
22.739 bln
-934.043 mln
-3.95%
jan 1, 2013
25.875 bln
+3.136 bln
13.79%
jan 1, 2014
30.454 bln
+4.579 bln
17.7%
jan 1, 2015
30.186 bln
-268.285 mln
-0.88%
jan 1, 2016
27.057 bln
-3.129 bln
-10.37%
Ranking of countries by current statistics by years


Comments: