29
/
en
AIzaSyAYiBZKx7MnpbEhh9jyipgxe19OcubqV5w
April 1, 2024
280391
Vanuatu
VUT
true
2
1
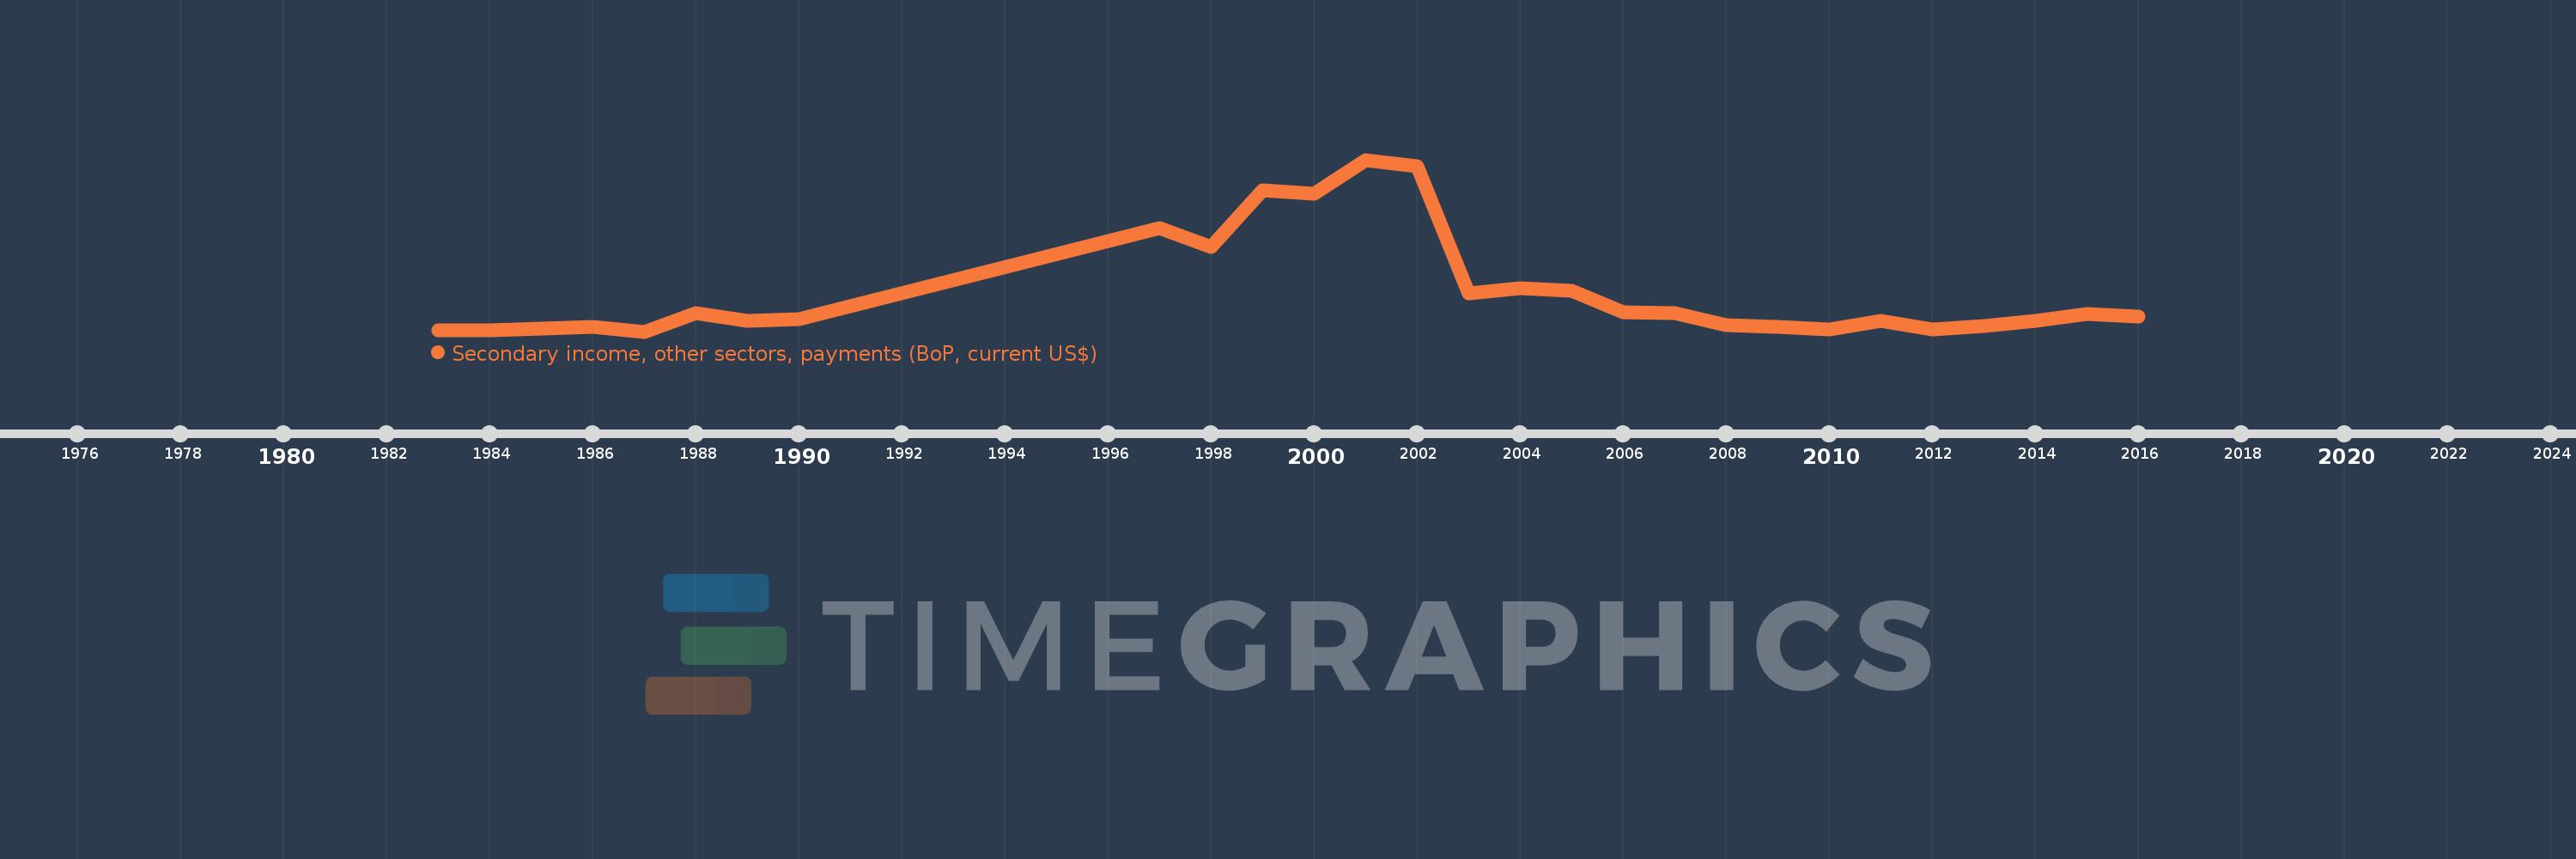
Secondary income, other sectors, payments (BoP, current US$)
2016,2015,2014,2013,2012,2011,2010,2009,2008,2007,2006,2005,2004,2003,2002,2001,2000,1999,1998,1997,1990,1989,1988,1987,1986,1985,1984,1983
This statistics in other country:
AfghanistanAlbaniaAlgeriaAngolaAntigua and BarbudaArab WorldArgentinaArmeniaArubaAustraliaAustriaAzerbaijanBahamas, TheBahrainBangladeshBarbadosBelarusBelgiumBelizeBeninBermudaBhutanBoliviaBosnia and HerzegovinaBotswanaBrazilBrunei DarussalamBulgariaBurkina FasoBurundiCabo VerdeCambodiaCameroonCanadaCaribbean small statesCentral African RepublicCentral Europe and the BalticsChadChileChinaColombiaComorosCongo, Dem. Rep.Congo, Rep.Costa RicaCote d'IvoireCroatiaCuracaoCyprusCzech RepublicDenmarkDjiboutiDominicaDominican RepublicEarly-demographic dividendEast Asia & PacificEast Asia & Pacific (excluding high income)East Asia & Pacific (IDA & IBRD countries)EcuadorEgypt, Arab Rep.El SalvadorEquatorial GuineaEritreaEstoniaEthiopiaEuro areaEurope & Central AsiaEurope & Central Asia (excluding high income)Europe & Central Asia (IDA & IBRD countries)European UnionFaroe IslandsFijiFinlandFragile and conflict affected situationsFranceFrench PolynesiaGabonGambia, TheGeorgiaGermanyGhanaGreeceGrenadaGuatemalaGuineaGuinea-BissauGuyanaHaitiHeavily indebted poor countries (HIPC)High incomeHondurasHong Kong SAR, ChinaHungaryIBRD onlyIcelandIDA & IBRD totalIDA blendIDA onlyIDA totalIndiaIndonesiaIran, Islamic Rep.IraqIrelandIsraelItalyJamaicaJapanJordanKazakhstanKenyaKiribatiKorea, Rep.KosovoKuwaitKyrgyz RepublicLao PDRLate-demographic dividendLatin America & Caribbean Latin America & Caribbean (excluding high income)Latin America & the Caribbean (IDA & IBRD countries)LatviaLeast developed countries: UN classificationLebanonLesothoLiberiaLibyaLithuaniaLow & middle incomeLow incomeLower middle incomeLuxembourgMacao SAR, ChinaMacedonia, FYRMadagascarMalawiMalaysiaMaldivesMaliMaltaMarshall IslandsMauritaniaMauritiusMexicoMicronesia, Fed. Sts.Middle East & North AfricaMiddle East & North Africa (excluding high income)Middle East & North Africa (IDA & IBRD countries)Middle incomeMoldovaMongoliaMontenegroMoroccoMozambiqueMyanmarNamibiaNepalNetherlandsNew CaledoniaNew ZealandNicaraguaNigerNigeriaNorth AmericaNorwayOECD membersOmanOther small statesPacific island small statesPakistanPalauPanamaPapua New GuineaParaguayPhilippinesPolandPortugalPost-demographic dividendPre-demographic dividendQatarRomaniaRussian FederationRwandaSamoaSao Tome and PrincipeSaudi ArabiaSenegalSerbiaSeychellesSierra LeoneSingaporeSint Maarten (Dutch part)Slovak RepublicSloveniaSmall statesSolomon IslandsSouth AfricaSouth AsiaSouth Asia (IDA & IBRD)South SudanSpainSri LankaSt. Kitts and NevisSt. LuciaSt. Vincent and the GrenadinesSub-Saharan Africa Sub-Saharan Africa (excluding high income)Sub-Saharan Africa (IDA & IBRD countries)SudanSurinameSwazilandSwedenSwitzerlandSyrian Arab RepublicTajikistanTanzaniaThailandTimor-LesteTogoTongaTrinidad and TobagoTunisiaTurkeyTuvaluUgandaUkraineUnited KingdomUnited StatesUpper middle incomeUruguayVanuatuVenezuela, RBVietnamWest Bank and GazaWorldYemen, Rep.ZambiaZimbabwe Timeline:
This timeline shows a graph from 1983 to 2016 of Vanuatu. No data until 1982. Number of actual observations by date: 28.
Source name:
World Development Indicators
Source organization:
International Monetary Fund, Balance of Payments Statistics Yearbook and data files.
Categories, topics:
Economy & Growth
Last updated:
apr 23, 2017
Indicators value changes by year
Minimum:
773.032K
jan 1, 1987
Maximum:
36.666 mln
jan 1, 2001
At the date of observation
Value
Absolute change
Change from previous value
jan 1, 1983
1.123 mln
+1.123 mln
0.0%
jan 1, 1984
1.087 mln
-35.701K
-3.18%
jan 1, 1985
1.472 mln
+385.067K
35.43%
jan 1, 1986
1.69 mln
+217.717K
14.79%
jan 1, 1987
773.032K
-916.624K
-54.25%
jan 1, 1988
4.712 mln
+3.939 mln
509.51%
jan 1, 1989
2.999 mln
-1.712 mln
-36.34%
jan 1, 1990
3.395 mln
+395.2K
13.18%
jan 1, 1997
22.444 mln
+19.05 mln
561.17%
jan 1, 1998
18.494 mln
-3.95 mln
-17.6%
jan 1, 1999
30.286 mln
+11.792 mln
63.76%
jan 1, 2000
29.634 mln
-652.203K
-2.15%
jan 1, 2001
36.666 mln
+7.031 mln
23.73%
jan 1, 2002
35.389 mln
-1.276 mln
-3.48%
jan 1, 2003
8.702 mln
-26.688 mln
-75.41%
jan 1, 2004
9.903 mln
+1.202 mln
13.81%
jan 1, 2005
9.358 mln
-545.208K
-5.51%
jan 1, 2006
4.796 mln
-4.562 mln
-48.75%
jan 1, 2007
4.544 mln
-251.371K
-5.24%
jan 1, 2008
2.181 mln
-2.364 mln
-52.01%
jan 1, 2009
1.734 mln
-446.532K
-20.48%
jan 1, 2010
1.228 mln
-505.901K
-29.17%
jan 1, 2011
2.994 mln
+1.765 mln
143.7%
jan 1, 2012
1.16 mln
-1.833 mln
-61.24%
jan 1, 2013
1.971 mln
+810.963K
69.89%
jan 1, 2014
3.059 mln
+1.088 mln
55.2%
jan 1, 2015
4.497 mln
+1.438 mln
47.01%
jan 1, 2016
3.942 mln
-555.511K
-12.35%
Ranking of countries by current statistics by years


Comments: