29
/
en
AIzaSyAYiBZKx7MnpbEhh9jyipgxe19OcubqV5w
April 1, 2024
224297
Philippines
PHL
true
2
1
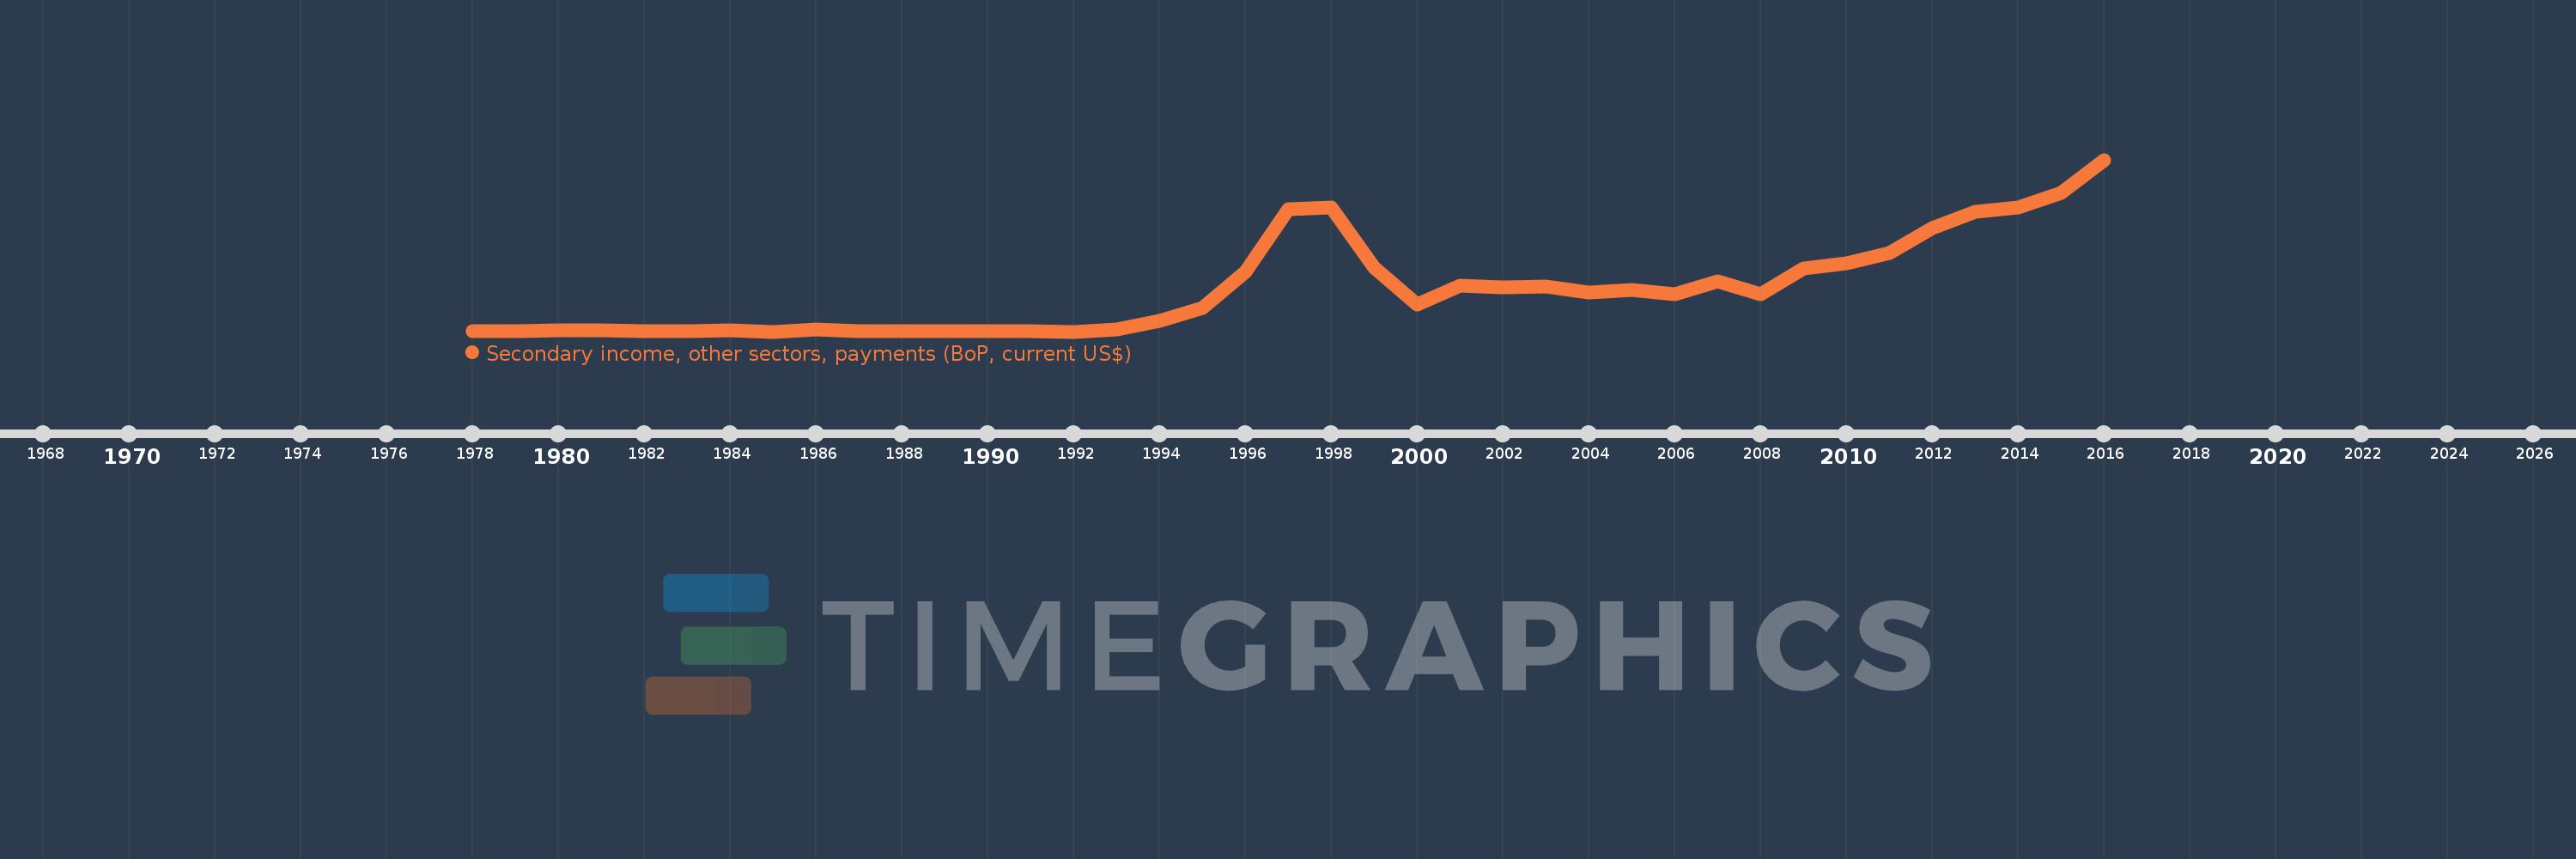
Secondary income, other sectors, payments (BoP, current US$)
2016,2015,2014,2013,2012,2011,2010,2009,2008,2007,2006,2005,2004,2003,2002,2001,2000,1999,1998,1997,1996,1995,1994,1993,1992,1991,1990,1989,1988,1987,1986,1985,1984,1983,1982,1981,1980,1979,1978
This statistics in other country:
AfghanistanAlbaniaAlgeriaAngolaAntigua and BarbudaArab WorldArgentinaArmeniaArubaAustraliaAustriaAzerbaijanBahamas, TheBahrainBangladeshBarbadosBelarusBelgiumBelizeBeninBermudaBhutanBoliviaBosnia and HerzegovinaBotswanaBrazilBrunei DarussalamBulgariaBurkina FasoBurundiCabo VerdeCambodiaCameroonCanadaCaribbean small statesCentral African RepublicCentral Europe and the BalticsChadChileChinaColombiaComorosCongo, Dem. Rep.Congo, Rep.Costa RicaCote d'IvoireCroatiaCuracaoCyprusCzech RepublicDenmarkDjiboutiDominicaDominican RepublicEarly-demographic dividendEast Asia & PacificEast Asia & Pacific (excluding high income)East Asia & Pacific (IDA & IBRD countries)EcuadorEgypt, Arab Rep.El SalvadorEquatorial GuineaEritreaEstoniaEthiopiaEuro areaEurope & Central AsiaEurope & Central Asia (excluding high income)Europe & Central Asia (IDA & IBRD countries)European UnionFaroe IslandsFijiFinlandFragile and conflict affected situationsFranceFrench PolynesiaGabonGambia, TheGeorgiaGermanyGhanaGreeceGrenadaGuatemalaGuineaGuinea-BissauGuyanaHaitiHeavily indebted poor countries (HIPC)High incomeHondurasHong Kong SAR, ChinaHungaryIBRD onlyIcelandIDA & IBRD totalIDA blendIDA onlyIDA totalIndiaIndonesiaIran, Islamic Rep.IraqIrelandIsraelItalyJamaicaJapanJordanKazakhstanKenyaKiribatiKorea, Rep.KosovoKuwaitKyrgyz RepublicLao PDRLate-demographic dividendLatin America & Caribbean Latin America & Caribbean (excluding high income)Latin America & the Caribbean (IDA & IBRD countries)LatviaLeast developed countries: UN classificationLebanonLesothoLiberiaLibyaLithuaniaLow & middle incomeLow incomeLower middle incomeLuxembourgMacao SAR, ChinaMacedonia, FYRMadagascarMalawiMalaysiaMaldivesMaliMaltaMarshall IslandsMauritaniaMauritiusMexicoMicronesia, Fed. Sts.Middle East & North AfricaMiddle East & North Africa (excluding high income)Middle East & North Africa (IDA & IBRD countries)Middle incomeMoldovaMongoliaMontenegroMoroccoMozambiqueMyanmarNamibiaNepalNetherlandsNew CaledoniaNew ZealandNicaraguaNigerNigeriaNorth AmericaNorwayOECD membersOmanOther small statesPacific island small statesPakistanPalauPanamaPapua New GuineaParaguayPhilippinesPolandPortugalPost-demographic dividendPre-demographic dividendQatarRomaniaRussian FederationRwandaSamoaSao Tome and PrincipeSaudi ArabiaSenegalSerbiaSeychellesSierra LeoneSingaporeSint Maarten (Dutch part)Slovak RepublicSloveniaSmall statesSolomon IslandsSouth AfricaSouth AsiaSouth Asia (IDA & IBRD)South SudanSpainSri LankaSt. Kitts and NevisSt. LuciaSt. Vincent and the GrenadinesSub-Saharan Africa Sub-Saharan Africa (excluding high income)Sub-Saharan Africa (IDA & IBRD countries)SudanSurinameSwazilandSwedenSwitzerlandSyrian Arab RepublicTajikistanTanzaniaThailandTimor-LesteTogoTongaTrinidad and TobagoTunisiaTurkeyTuvaluUgandaUkraineUnited KingdomUnited StatesUpper middle incomeUruguayVanuatuVenezuela, RBVietnamWest Bank and GazaWorldYemen, Rep.ZambiaZimbabwe Timeline:
This timeline shows a graph from 1978 to 2016 of Philippines. No data until 1977. Number of actual observations by date: 39.
Source name:
World Development Indicators
Source organization:
International Monetary Fund, Balance of Payments Statistics Yearbook and data files.
Categories, topics:
Economy & Growth
Last updated:
apr 23, 2017
Indicators value changes by year
Minimum:
1000.0K
jan 1, 1985
Maximum:
767.564 mln
jan 1, 2016
At the date of observation
Value
Absolute change
Change from previous value
jan 1, 1978
4.0 mln
+4.0 mln
0.0%
jan 1, 1979
3.0 mln
-1000.0K
-25.0%
jan 1, 1980
5.0 mln
+2.0 mln
66.67%
jan 1, 1981
6.0 mln
+1000.0K
20.0%
jan 1, 1982
3.0 mln
-3.0 mln
-50.0%
jan 1, 1983
2.0 mln
-1000.0K
-33.33%
jan 1, 1984
5.0 mln
+3.0 mln
150.0%
jan 1, 1985
1000.0K
-4.0 mln
-80.0%
jan 1, 1986
9.0 mln
+8.0 mln
800.0%
jan 1, 1987
4.0 mln
-5.0 mln
-55.56%
jan 1, 1988
2.0 mln
-2.0 mln
-50.0%
jan 1, 1989
3.0 mln
+1000.0K
50.0%
jan 1, 1990
2.0 mln
-1000.0K
-33.33%
jan 1, 1991
3.0 mln
+1000.0K
50.0%
jan 1, 1992
1000.0K
-2.0 mln
-66.67%
jan 1, 1993
9.0 mln
+8.0 mln
800.0%
jan 1, 1994
47.0 mln
+38.0 mln
422.22%
jan 1, 1995
105.0 mln
+58.0 mln
123.4%
jan 1, 1996
267.0 mln
+162.0 mln
154.29%
jan 1, 1997
548.0 mln
+281.0 mln
105.24%
jan 1, 1998
554.0 mln
+6.0 mln
1.09%
jan 1, 1999
287.0 mln
-267.0 mln
-48.19%
jan 1, 2000
123.0 mln
-164.0 mln
-57.14%
jan 1, 2001
205.0 mln
+82.0 mln
66.67%
jan 1, 2002
197.0 mln
-8.0 mln
-3.9%
jan 1, 2003
202.0 mln
+5.0 mln
2.54%
jan 1, 2004
175.0 mln
-27.0 mln
-13.37%
jan 1, 2005
187.0 mln
+12.0 mln
6.86%
jan 1, 2006
169.49 mln
-17.51 mln
-9.36%
jan 1, 2007
223.47 mln
+53.98 mln
31.85%
jan 1, 2008
169.005 mln
-54.465 mln
-24.37%
jan 1, 2009
281.488 mln
+112.483 mln
66.56%
jan 1, 2010
307.174 mln
+25.686 mln
9.13%
jan 1, 2011
352.064 mln
+44.89 mln
14.61%
jan 1, 2012
462.2 mln
+110.136 mln
31.28%
jan 1, 2013
536.307 mln
+74.107 mln
16.03%
jan 1, 2014
556.708 mln
+20.401 mln
3.8%
jan 1, 2015
620.209 mln
+63.5 mln
11.41%
jan 1, 2016
767.564 mln
+147.355 mln
23.76%
Ranking of countries by current statistics by years


Comments: