29
/
en
AIzaSyAYiBZKx7MnpbEhh9jyipgxe19OcubqV5w
April 1, 2024
268694
Tunisia
TUN
true
2
1
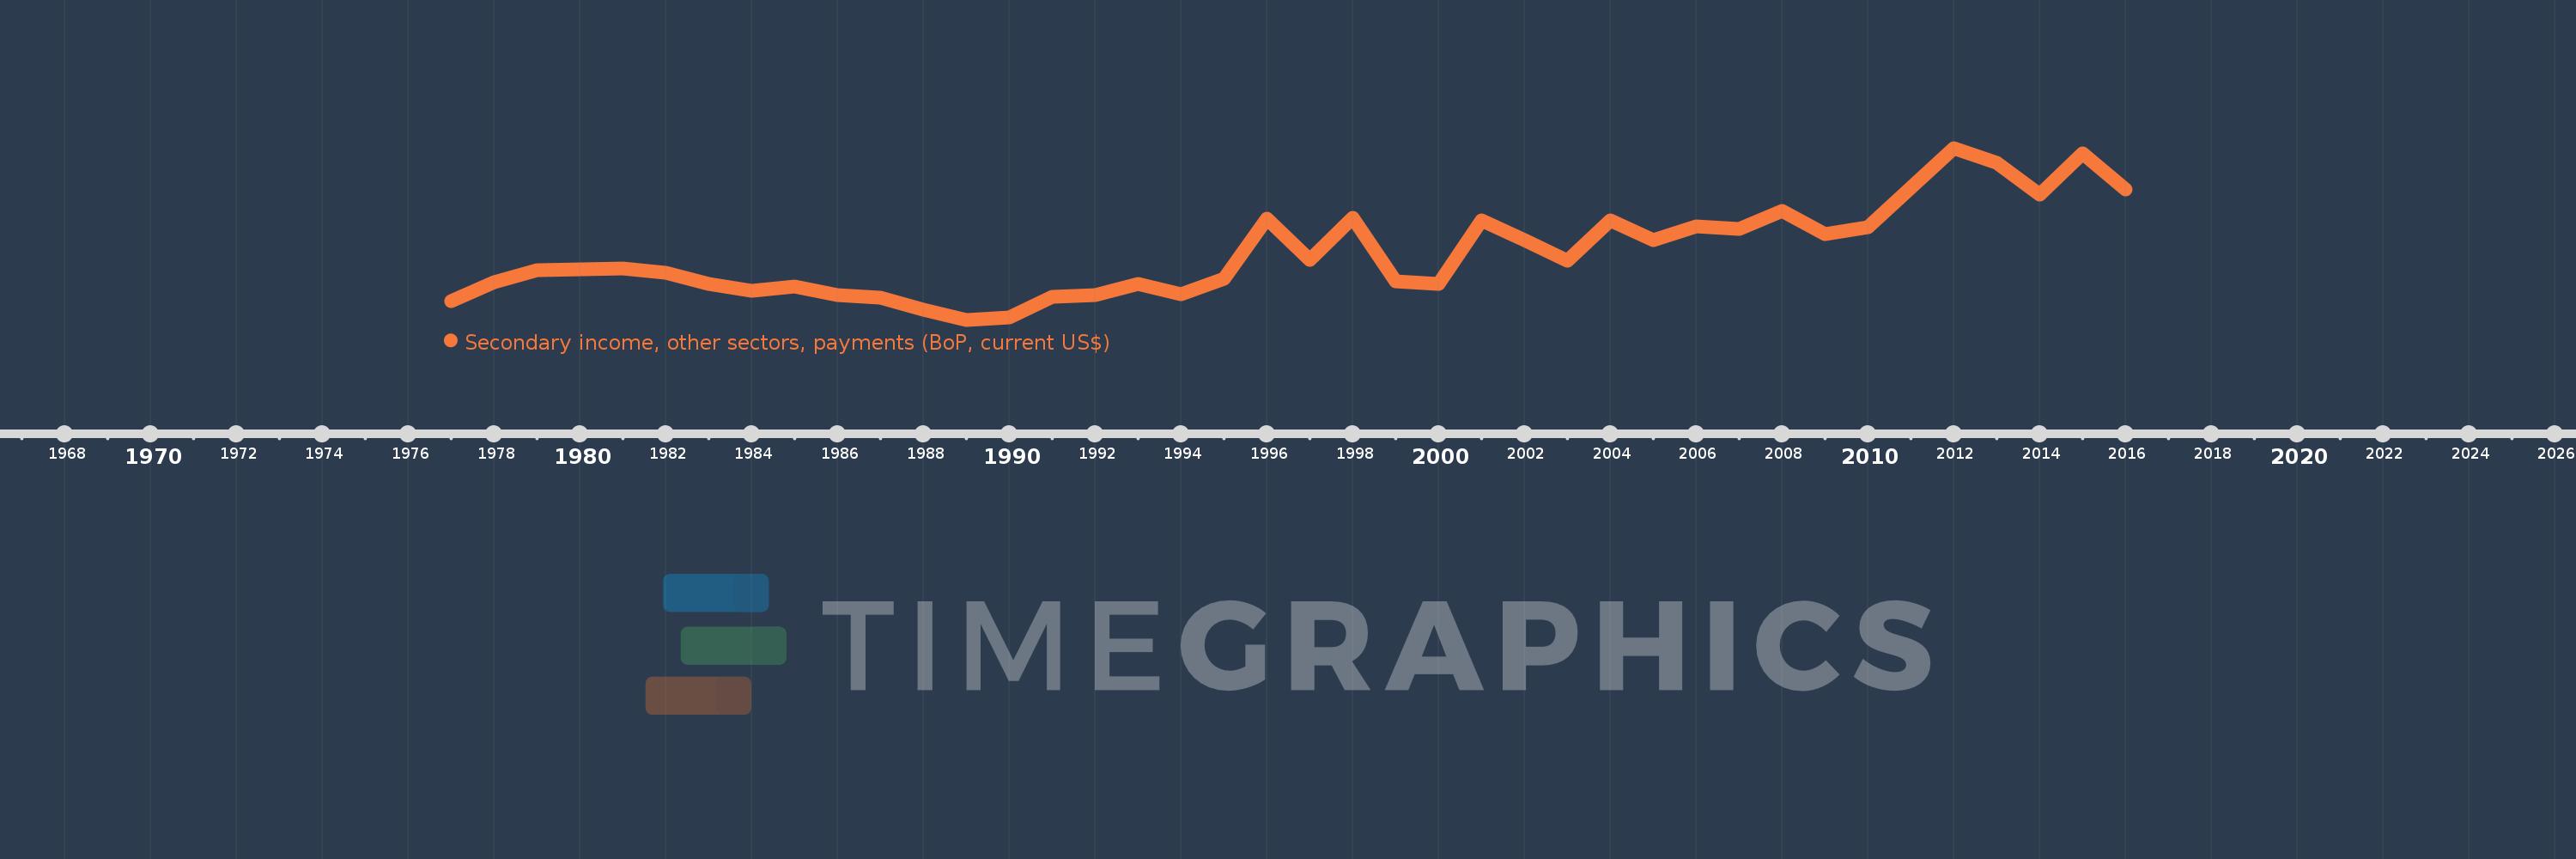
Secondary income, other sectors, payments (BoP, current US$)
2016,2015,2014,2013,2012,2011,2010,2009,2008,2007,2006,2005,2004,2003,2002,2001,2000,1999,1998,1997,1996,1995,1994,1993,1992,1991,1990,1989,1988,1987,1986,1985,1984,1983,1982,1981,1980,1979,1978,1977
This statistics in other country:
AfghanistanAlbaniaAlgeriaAngolaAntigua and BarbudaArab WorldArgentinaArmeniaArubaAustraliaAustriaAzerbaijanBahamas, TheBahrainBangladeshBarbadosBelarusBelgiumBelizeBeninBermudaBhutanBoliviaBosnia and HerzegovinaBotswanaBrazilBrunei DarussalamBulgariaBurkina FasoBurundiCabo VerdeCambodiaCameroonCanadaCaribbean small statesCentral African RepublicCentral Europe and the BalticsChadChileChinaColombiaComorosCongo, Dem. Rep.Congo, Rep.Costa RicaCote d'IvoireCroatiaCuracaoCyprusCzech RepublicDenmarkDjiboutiDominicaDominican RepublicEarly-demographic dividendEast Asia & PacificEast Asia & Pacific (excluding high income)East Asia & Pacific (IDA & IBRD countries)EcuadorEgypt, Arab Rep.El SalvadorEquatorial GuineaEritreaEstoniaEthiopiaEuro areaEurope & Central AsiaEurope & Central Asia (excluding high income)Europe & Central Asia (IDA & IBRD countries)European UnionFaroe IslandsFijiFinlandFragile and conflict affected situationsFranceFrench PolynesiaGabonGambia, TheGeorgiaGermanyGhanaGreeceGrenadaGuatemalaGuineaGuinea-BissauGuyanaHaitiHeavily indebted poor countries (HIPC)High incomeHondurasHong Kong SAR, ChinaHungaryIBRD onlyIcelandIDA & IBRD totalIDA blendIDA onlyIDA totalIndiaIndonesiaIran, Islamic Rep.IraqIrelandIsraelItalyJamaicaJapanJordanKazakhstanKenyaKiribatiKorea, Rep.KosovoKuwaitKyrgyz RepublicLao PDRLate-demographic dividendLatin America & Caribbean Latin America & Caribbean (excluding high income)Latin America & the Caribbean (IDA & IBRD countries)LatviaLeast developed countries: UN classificationLebanonLesothoLiberiaLibyaLithuaniaLow & middle incomeLow incomeLower middle incomeLuxembourgMacao SAR, ChinaMacedonia, FYRMadagascarMalawiMalaysiaMaldivesMaliMaltaMarshall IslandsMauritaniaMauritiusMexicoMicronesia, Fed. Sts.Middle East & North AfricaMiddle East & North Africa (excluding high income)Middle East & North Africa (IDA & IBRD countries)Middle incomeMoldovaMongoliaMontenegroMoroccoMozambiqueMyanmarNamibiaNepalNetherlandsNew CaledoniaNew ZealandNicaraguaNigerNigeriaNorth AmericaNorwayOECD membersOmanOther small statesPacific island small statesPakistanPalauPanamaPapua New GuineaParaguayPhilippinesPolandPortugalPost-demographic dividendPre-demographic dividendQatarRomaniaRussian FederationRwandaSamoaSao Tome and PrincipeSaudi ArabiaSenegalSerbiaSeychellesSierra LeoneSingaporeSint Maarten (Dutch part)Slovak RepublicSloveniaSmall statesSolomon IslandsSouth AfricaSouth AsiaSouth Asia (IDA & IBRD)South SudanSpainSri LankaSt. Kitts and NevisSt. LuciaSt. Vincent and the GrenadinesSub-Saharan Africa Sub-Saharan Africa (excluding high income)Sub-Saharan Africa (IDA & IBRD countries)SudanSurinameSwazilandSwedenSwitzerlandSyrian Arab RepublicTajikistanTanzaniaThailandTimor-LesteTogoTongaTrinidad and TobagoTunisiaTurkeyTuvaluUgandaUkraineUnited KingdomUnited StatesUpper middle incomeUruguayVanuatuVenezuela, RBVietnamWest Bank and GazaWorldYemen, Rep.ZambiaZimbabwe Timeline:
This timeline shows a graph from 1977 to 2016 of Tunisia. No data until 1976. Number of actual observations by date: 40.
Source name:
World Development Indicators
Source organization:
International Monetary Fund, Balance of Payments Statistics Yearbook and data files.
Categories, topics:
Economy & Growth
Last updated:
apr 23, 2017
Indicators value changes by year
Minimum:
4.663 mln
jan 1, 1989
Maximum:
47.095 mln
jan 1, 2012
At the date of observation
Value
Absolute change
Change from previous value
jan 1, 1977
9.329 mln
+9.329 mln
0.0%
jan 1, 1978
13.988 mln
+4.659 mln
49.94%
jan 1, 1979
16.82 mln
+2.832 mln
20.25%
jan 1, 1980
17.222 mln
+401.745K
2.39%
jan 1, 1981
17.286 mln
+64.146K
0.37%
jan 1, 1982
16.201 mln
-1.085 mln
-6.28%
jan 1, 1983
13.544 mln
-2.657 mln
-16.4%
jan 1, 1984
11.786 mln
-1.757 mln
-12.98%
jan 1, 1985
12.873 mln
+1.087 mln
9.22%
jan 1, 1986
10.785 mln
-2.088 mln
-16.22%
jan 1, 1987
10.075 mln
-709.758K
-6.58%
jan 1, 1988
7.241 mln
-2.835 mln
-28.13%
jan 1, 1989
4.663 mln
-2.578 mln
-35.6%
jan 1, 1990
5.267 mln
+603.854K
12.95%
jan 1, 1991
10.247 mln
+4.98 mln
94.55%
jan 1, 1992
10.815 mln
+568.565K
5.55%
jan 1, 1993
13.568 mln
+2.753 mln
25.45%
jan 1, 1994
10.959 mln
-2.609 mln
-19.23%
jan 1, 1995
14.829 mln
+3.87 mln
35.31%
jan 1, 1996
29.606 mln
+14.777 mln
99.65%
jan 1, 1997
19.519 mln
-10.087 mln
-34.07%
jan 1, 1998
29.84 mln
+10.321 mln
52.87%
jan 1, 1999
14.051 mln
-15.789 mln
-52.91%
jan 1, 2000
13.488 mln
-562.636K
-4.0%
jan 1, 2001
29.183 mln
+15.694 mln
116.36%
jan 1, 2002
24.327 mln
-4.855 mln
-16.64%
jan 1, 2003
19.202 mln
-5.125 mln
-21.07%
jan 1, 2004
29.182 mln
+9.98 mln
51.98%
jan 1, 2005
24.248 mln
-4.934 mln
-16.91%
jan 1, 2006
27.67 mln
+3.422 mln
14.11%
jan 1, 2007
27.047 mln
-623.19K
-2.25%
jan 1, 2008
31.529 mln
+4.482 mln
16.57%
jan 1, 2009
25.728 mln
-5.801 mln
-18.4%
jan 1, 2010
27.55 mln
+1.822 mln
7.08%
jan 1, 2011
37.166 mln
+9.616 mln
34.91%
jan 1, 2012
47.095 mln
+9.929 mln
26.71%
jan 1, 2013
43.473 mln
-3.622 mln
-7.69%
jan 1, 2014
35.638 mln
-7.835 mln
-18.02%
jan 1, 2015
45.768 mln
+10.13 mln
28.43%
jan 1, 2016
36.755 mln
-9.013 mln
-19.69%
Ranking of countries by current statistics by years


Comments: