29
/
en
AIzaSyAYiBZKx7MnpbEhh9jyipgxe19OcubqV5w
April 1, 2024
226390
Portugal
PRT
true
2
1
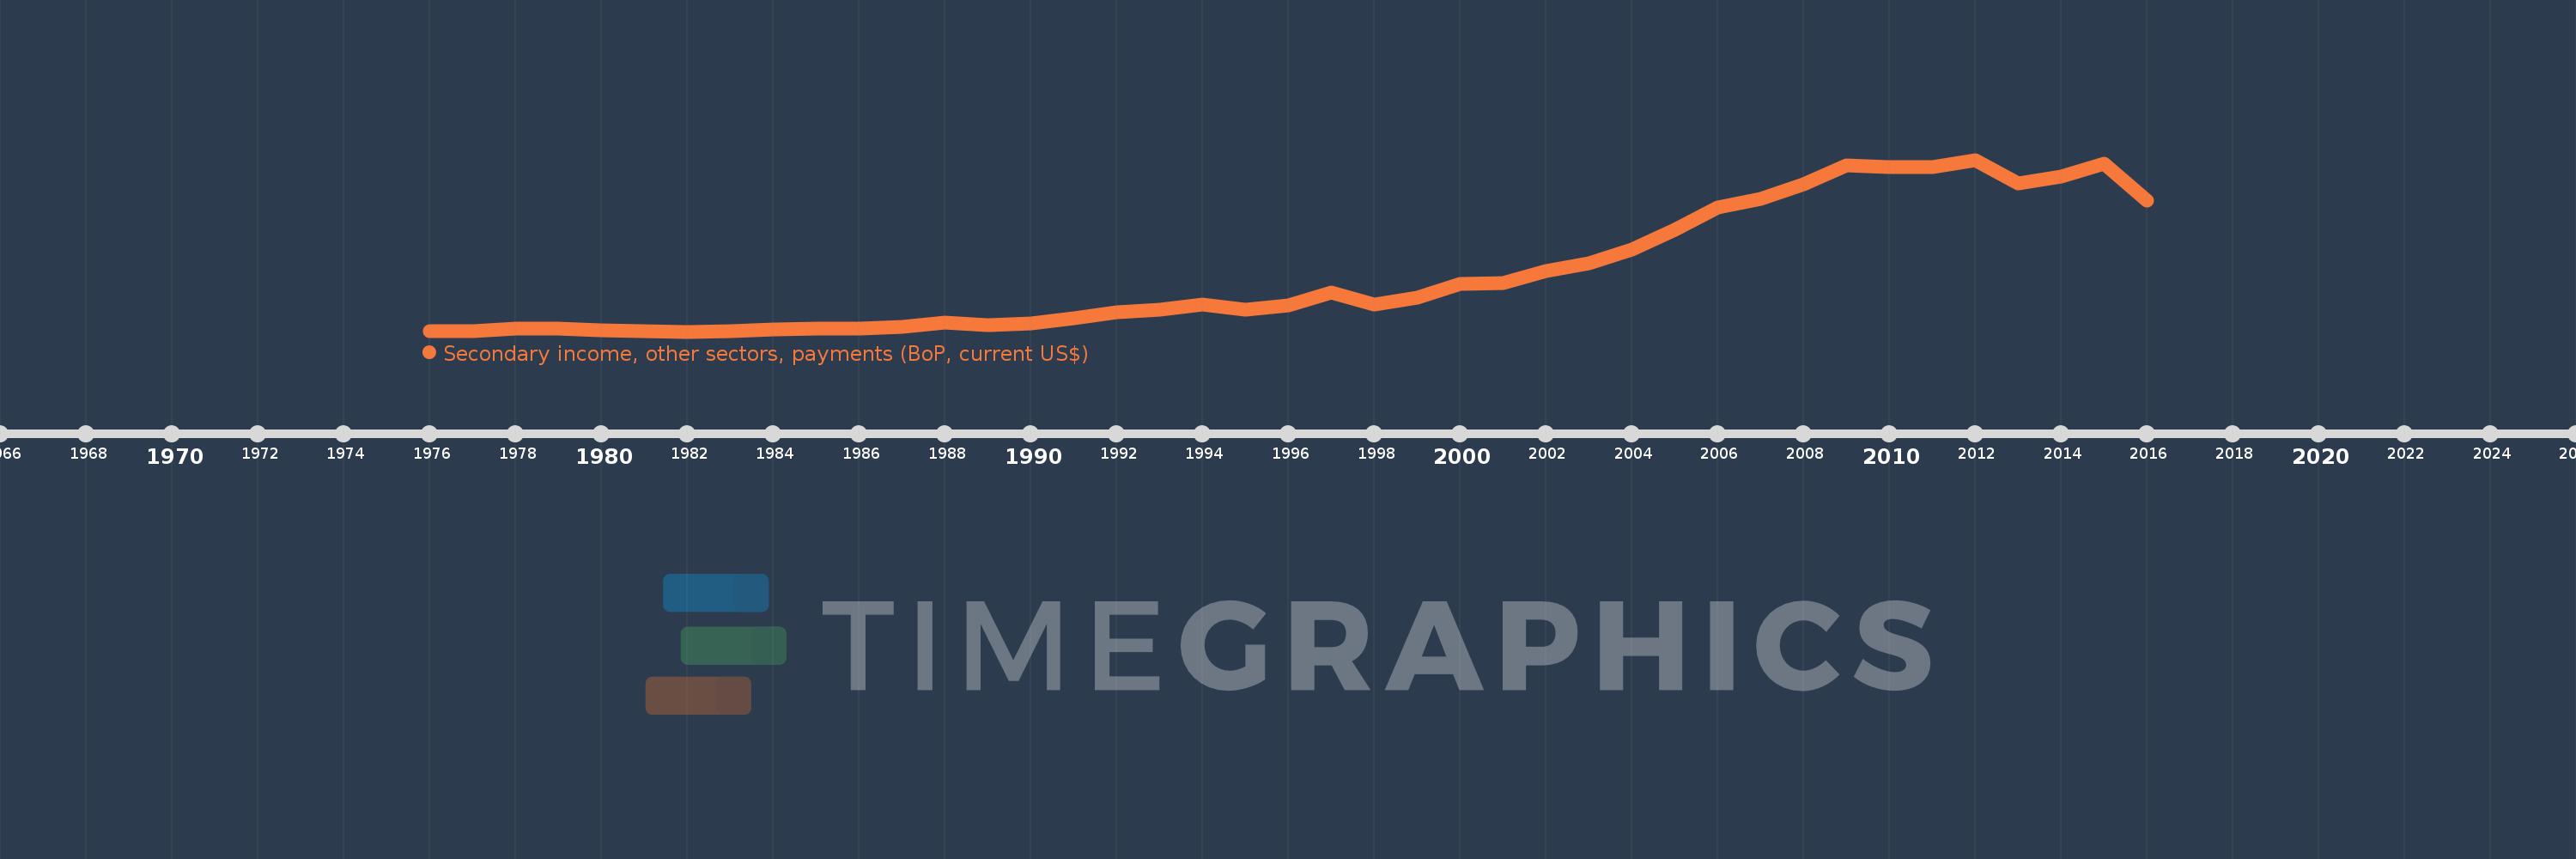
Secondary income, other sectors, payments (BoP, current US$)
2016,2015,2014,2013,2012,2011,2010,2009,2008,2007,2006,2005,2004,2003,2002,2001,2000,1999,1998,1997,1996,1995,1994,1993,1992,1991,1990,1989,1988,1987,1986,1985,1984,1983,1982,1981,1980,1979,1978,1977,1976
This statistics in other country:
AfghanistanAlbaniaAlgeriaAngolaAntigua and BarbudaArab WorldArgentinaArmeniaArubaAustraliaAustriaAzerbaijanBahamas, TheBahrainBangladeshBarbadosBelarusBelgiumBelizeBeninBermudaBhutanBoliviaBosnia and HerzegovinaBotswanaBrazilBrunei DarussalamBulgariaBurkina FasoBurundiCabo VerdeCambodiaCameroonCanadaCaribbean small statesCentral African RepublicCentral Europe and the BalticsChadChileChinaColombiaComorosCongo, Dem. Rep.Congo, Rep.Costa RicaCote d'IvoireCroatiaCuracaoCyprusCzech RepublicDenmarkDjiboutiDominicaDominican RepublicEarly-demographic dividendEast Asia & PacificEast Asia & Pacific (excluding high income)East Asia & Pacific (IDA & IBRD countries)EcuadorEgypt, Arab Rep.El SalvadorEquatorial GuineaEritreaEstoniaEthiopiaEuro areaEurope & Central AsiaEurope & Central Asia (excluding high income)Europe & Central Asia (IDA & IBRD countries)European UnionFaroe IslandsFijiFinlandFragile and conflict affected situationsFranceFrench PolynesiaGabonGambia, TheGeorgiaGermanyGhanaGreeceGrenadaGuatemalaGuineaGuinea-BissauGuyanaHaitiHeavily indebted poor countries (HIPC)High incomeHondurasHong Kong SAR, ChinaHungaryIBRD onlyIcelandIDA & IBRD totalIDA blendIDA onlyIDA totalIndiaIndonesiaIran, Islamic Rep.IraqIrelandIsraelItalyJamaicaJapanJordanKazakhstanKenyaKiribatiKorea, Rep.KosovoKuwaitKyrgyz RepublicLao PDRLate-demographic dividendLatin America & Caribbean Latin America & Caribbean (excluding high income)Latin America & the Caribbean (IDA & IBRD countries)LatviaLeast developed countries: UN classificationLebanonLesothoLiberiaLibyaLithuaniaLow & middle incomeLow incomeLower middle incomeLuxembourgMacao SAR, ChinaMacedonia, FYRMadagascarMalawiMalaysiaMaldivesMaliMaltaMarshall IslandsMauritaniaMauritiusMexicoMicronesia, Fed. Sts.Middle East & North AfricaMiddle East & North Africa (excluding high income)Middle East & North Africa (IDA & IBRD countries)Middle incomeMoldovaMongoliaMontenegroMoroccoMozambiqueMyanmarNamibiaNepalNetherlandsNew CaledoniaNew ZealandNicaraguaNigerNigeriaNorth AmericaNorwayOECD membersOmanOther small statesPacific island small statesPakistanPalauPanamaPapua New GuineaParaguayPhilippinesPolandPortugalPost-demographic dividendPre-demographic dividendQatarRomaniaRussian FederationRwandaSamoaSao Tome and PrincipeSaudi ArabiaSenegalSerbiaSeychellesSierra LeoneSingaporeSint Maarten (Dutch part)Slovak RepublicSloveniaSmall statesSolomon IslandsSouth AfricaSouth AsiaSouth Asia (IDA & IBRD)South SudanSpainSri LankaSt. Kitts and NevisSt. LuciaSt. Vincent and the GrenadinesSub-Saharan Africa Sub-Saharan Africa (excluding high income)Sub-Saharan Africa (IDA & IBRD countries)SudanSurinameSwazilandSwedenSwitzerlandSyrian Arab RepublicTajikistanTanzaniaThailandTimor-LesteTogoTongaTrinidad and TobagoTunisiaTurkeyTuvaluUgandaUkraineUnited KingdomUnited StatesUpper middle incomeUruguayVanuatuVenezuela, RBVietnamWest Bank and GazaWorldYemen, Rep.ZambiaZimbabwe Timeline:
This timeline shows a graph from 1976 to 2016 of Portugal. No data until 1975. Number of actual observations by date: 41.
Source name:
World Development Indicators
Source organization:
International Monetary Fund, Balance of Payments Statistics Yearbook and data files.
Categories, topics:
Economy & Growth
Last updated:
apr 23, 2017
Indicators value changes by year
Minimum:
29.237 mln
jan 1, 1982
Maximum:
3.06 bln
jan 1, 2012
At the date of observation
Value
Absolute change
Change from previous value
jan 1, 1976
33.01 mln
+33.01 mln
0.0%
jan 1, 1977
41.503 mln
+8.493 mln
25.73%
jan 1, 1978
88.808 mln
+47.305 mln
113.98%
jan 1, 1979
82.775 mln
-6.033 mln
-6.79%
jan 1, 1980
59.022 mln
-23.753 mln
-28.7%
jan 1, 1981
41.111 mln
-17.911 mln
-30.35%
jan 1, 1982
29.237 mln
-11.875 mln
-28.88%
jan 1, 1983
38.433 mln
+9.197 mln
31.46%
jan 1, 1984
67.555 mln
+29.121 mln
75.77%
jan 1, 1985
80.335 mln
+12.781 mln
18.92%
jan 1, 1986
82.386 mln
+2.051 mln
2.55%
jan 1, 1987
112.456 mln
+30.07 mln
36.5%
jan 1, 1988
191.866 mln
+79.41 mln
70.61%
jan 1, 1989
142.197 mln
-49.669 mln
-25.89%
jan 1, 1990
173.525 mln
+31.328 mln
22.03%
jan 1, 1991
259.673 mln
+86.148 mln
49.65%
jan 1, 1992
364.783 mln
+105.11 mln
40.48%
jan 1, 1993
410.854 mln
+46.071 mln
12.63%
jan 1, 1994
509.193 mln
+98.339 mln
23.94%
jan 1, 1995
420.428 mln
-88.765 mln
-17.43%
jan 1, 1996
491.226 mln
+70.798 mln
16.84%
jan 1, 1997
721.748 mln
+230.523 mln
46.93%
jan 1, 1998
500.34 mln
-221.409 mln
-30.68%
jan 1, 1999
627.293 mln
+126.953 mln
25.37%
jan 1, 2000
866.371 mln
+239.077 mln
38.11%
jan 1, 2001
881.37 mln
+14.999 mln
1.73%
jan 1, 2002
1.099 bln
+218.07 mln
24.74%
jan 1, 2003
1.238 bln
+138.476 mln
12.6%
jan 1, 2004
1.473 bln
+235.09 mln
18.99%
jan 1, 2005
1.825 bln
+352.289 mln
23.92%
jan 1, 2006
2.219 bln
+393.711 mln
21.57%
jan 1, 2007
2.373 bln
+154.339 mln
6.96%
jan 1, 2008
2.628 bln
+254.952 mln
10.74%
jan 1, 2009
2.957 bln
+328.602 mln
12.5%
jan 1, 2010
2.929 bln
-27.826 mln
-0.94%
jan 1, 2011
2.935 bln
+5.822 mln
0.2%
jan 1, 2012
3.06 bln
+125.27 mln
4.27%
jan 1, 2013
2.64 bln
-419.938 mln
-13.72%
jan 1, 2014
2.757 bln
+117.201 mln
4.44%
jan 1, 2015
2.996 bln
+238.626 mln
8.65%
jan 1, 2016
2.338 bln
-657.986 mln
-21.96%
Ranking of countries by current statistics by years


Comments: