29
/
en
AIzaSyAYiBZKx7MnpbEhh9jyipgxe19OcubqV5w
April 1, 2024
84762
Benin
BEN
true
2
1
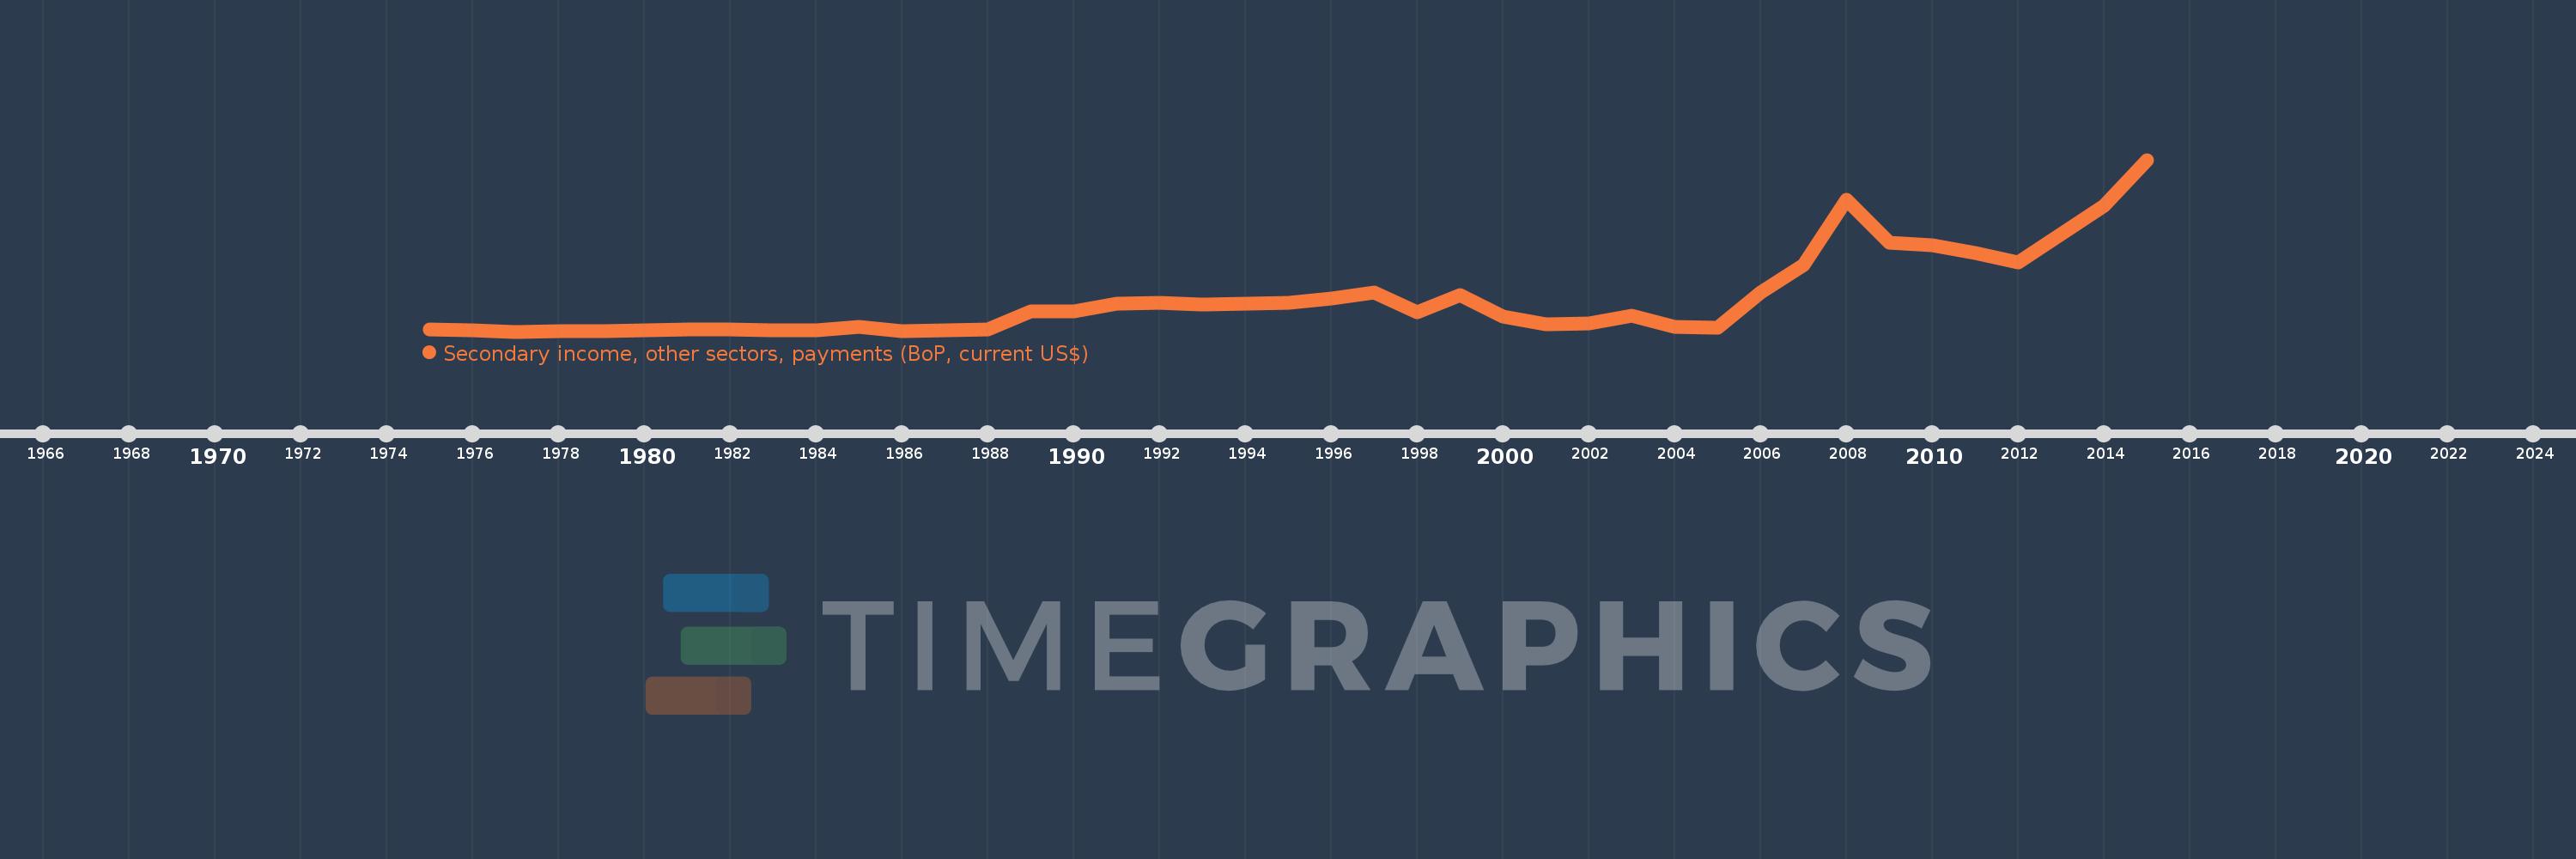
Secondary income, other sectors, payments (BoP, current US$)
2015,2014,2013,2012,2011,2010,2009,2008,2007,2006,2005,2004,2003,2002,2001,2000,1999,1998,1997,1996,1995,1994,1993,1992,1991,1990,1989,1988,1987,1986,1985,1984,1983,1982,1981,1980,1979,1978,1977,1976,1975
This statistics in other country:
AfghanistanAlbaniaAlgeriaAngolaAntigua and BarbudaArab WorldArgentinaArmeniaArubaAustraliaAustriaAzerbaijanBahamas, TheBahrainBangladeshBarbadosBelarusBelgiumBelizeBeninBermudaBhutanBoliviaBosnia and HerzegovinaBotswanaBrazilBrunei DarussalamBulgariaBurkina FasoBurundiCabo VerdeCambodiaCameroonCanadaCaribbean small statesCentral African RepublicCentral Europe and the BalticsChadChileChinaColombiaComorosCongo, Dem. Rep.Congo, Rep.Costa RicaCote d'IvoireCroatiaCuracaoCyprusCzech RepublicDenmarkDjiboutiDominicaDominican RepublicEarly-demographic dividendEast Asia & PacificEast Asia & Pacific (excluding high income)East Asia & Pacific (IDA & IBRD countries)EcuadorEgypt, Arab Rep.El SalvadorEquatorial GuineaEritreaEstoniaEthiopiaEuro areaEurope & Central AsiaEurope & Central Asia (excluding high income)Europe & Central Asia (IDA & IBRD countries)European UnionFaroe IslandsFijiFinlandFragile and conflict affected situationsFranceFrench PolynesiaGabonGambia, TheGeorgiaGermanyGhanaGreeceGrenadaGuatemalaGuineaGuinea-BissauGuyanaHaitiHeavily indebted poor countries (HIPC)High incomeHondurasHong Kong SAR, ChinaHungaryIBRD onlyIcelandIDA & IBRD totalIDA blendIDA onlyIDA totalIndiaIndonesiaIran, Islamic Rep.IraqIrelandIsraelItalyJamaicaJapanJordanKazakhstanKenyaKiribatiKorea, Rep.KosovoKuwaitKyrgyz RepublicLao PDRLate-demographic dividendLatin America & Caribbean Latin America & Caribbean (excluding high income)Latin America & the Caribbean (IDA & IBRD countries)LatviaLeast developed countries: UN classificationLebanonLesothoLiberiaLibyaLithuaniaLow & middle incomeLow incomeLower middle incomeLuxembourgMacao SAR, ChinaMacedonia, FYRMadagascarMalawiMalaysiaMaldivesMaliMaltaMarshall IslandsMauritaniaMauritiusMexicoMicronesia, Fed. Sts.Middle East & North AfricaMiddle East & North Africa (excluding high income)Middle East & North Africa (IDA & IBRD countries)Middle incomeMoldovaMongoliaMontenegroMoroccoMozambiqueMyanmarNamibiaNepalNetherlandsNew CaledoniaNew ZealandNicaraguaNigerNigeriaNorth AmericaNorwayOECD membersOmanOther small statesPacific island small statesPakistanPalauPanamaPapua New GuineaParaguayPhilippinesPolandPortugalPost-demographic dividendPre-demographic dividendQatarRomaniaRussian FederationRwandaSamoaSao Tome and PrincipeSaudi ArabiaSenegalSerbiaSeychellesSierra LeoneSingaporeSint Maarten (Dutch part)Slovak RepublicSloveniaSmall statesSolomon IslandsSouth AfricaSouth AsiaSouth Asia (IDA & IBRD)South SudanSpainSri LankaSt. Kitts and NevisSt. LuciaSt. Vincent and the GrenadinesSub-Saharan Africa Sub-Saharan Africa (excluding high income)Sub-Saharan Africa (IDA & IBRD countries)SudanSurinameSwazilandSwedenSwitzerlandSyrian Arab RepublicTajikistanTanzaniaThailandTimor-LesteTogoTongaTrinidad and TobagoTunisiaTurkeyTuvaluUgandaUkraineUnited KingdomUnited StatesUpper middle incomeUruguayVanuatuVenezuela, RBVietnamWest Bank and GazaWorldYemen, Rep.ZambiaZimbabwe Timeline:
This timeline shows a graph from 1975 to 2015 of Benin. No data until 1974. Number of actual observations by date: 41.
Source name:
World Development Indicators
Source organization:
International Monetary Fund, Balance of Payments Statistics Yearbook and data files.
Categories, topics:
Economy & Growth
Last updated:
apr 23, 2017
Indicators value changes by year
Minimum:
1.812 mln
jan 1, 1977
Maximum:
136.414 mln
jan 1, 2015
At the date of observation
Value
Absolute change
Change from previous value
jan 1, 1975
3.191 mln
+3.191 mln
0.0%
jan 1, 1976
3.108 mln
-83.026K
-2.6%
jan 1, 1977
1.812 mln
-1.296 mln
-41.69%
jan 1, 1978
1.909 mln
+96.899K
5.35%
jan 1, 1979
2.473 mln
+563.802K
29.53%
jan 1, 1980
3.046 mln
+573.442K
23.19%
jan 1, 1981
3.583 mln
+536.696K
17.62%
jan 1, 1982
3.695 mln
+111.894K
3.12%
jan 1, 1983
2.605 mln
-1.09 mln
-29.5%
jan 1, 1984
2.75 mln
+145.238K
5.58%
jan 1, 1985
5.287 mln
+2.536 mln
92.23%
jan 1, 1986
2.226 mln
-3.061 mln
-57.9%
jan 1, 1987
2.888 mln
+661.753K
29.73%
jan 1, 1988
3.327 mln
+439.762K
15.23%
jan 1, 1989
17.646 mln
+14.318 mln
430.31%
jan 1, 1990
17.496 mln
-149.468K
-0.85%
jan 1, 1991
23.638 mln
+6.142 mln
35.1%
jan 1, 1992
24.493 mln
+854.824K
3.62%
jan 1, 1993
23.058 mln
-1.435 mln
-5.86%
jan 1, 1994
23.35 mln
+292.43K
1.27%
jan 1, 1995
24.412 mln
+1.062 mln
4.55%
jan 1, 1996
27.676 mln
+3.264 mln
13.37%
jan 1, 1997
32.646 mln
+4.97 mln
17.96%
jan 1, 1998
16.742 mln
-15.903 mln
-48.72%
jan 1, 1999
30.509 mln
+13.767 mln
82.23%
jan 1, 2000
13.511 mln
-16.998 mln
-55.71%
jan 1, 2001
7.725 mln
-5.786 mln
-42.83%
jan 1, 2002
8.079 mln
+353.726K
4.58%
jan 1, 2003
13.944 mln
+5.866 mln
72.61%
jan 1, 2004
5.287 mln
-8.657 mln
-62.08%
jan 1, 2005
5.014 mln
-272.993K
-5.16%
jan 1, 2006
32.18 mln
+27.166 mln
541.76%
jan 1, 2007
53.99 mln
+21.81 mln
67.78%
jan 1, 2008
105.321 mln
+51.331 mln
95.07%
jan 1, 2009
71.214 mln
-34.107 mln
-32.38%
jan 1, 2010
69.168 mln
-2.046 mln
-2.87%
jan 1, 2011
63.492 mln
-5.676 mln
-8.21%
jan 1, 2012
56.29 mln
-7.202 mln
-11.34%
jan 1, 2013
78.471 mln
+22.181 mln
39.41%
jan 1, 2014
100.16 mln
+21.689 mln
27.64%
jan 1, 2015
136.414 mln
+36.254 mln
36.2%
Ranking of countries by current statistics by years


Comments: