29
/
en
AIzaSyAYiBZKx7MnpbEhh9jyipgxe19OcubqV5w
April 1, 2024
43874
Latin America & the Caribbean (IDA & IBRD countries)
TLA
false
2
1
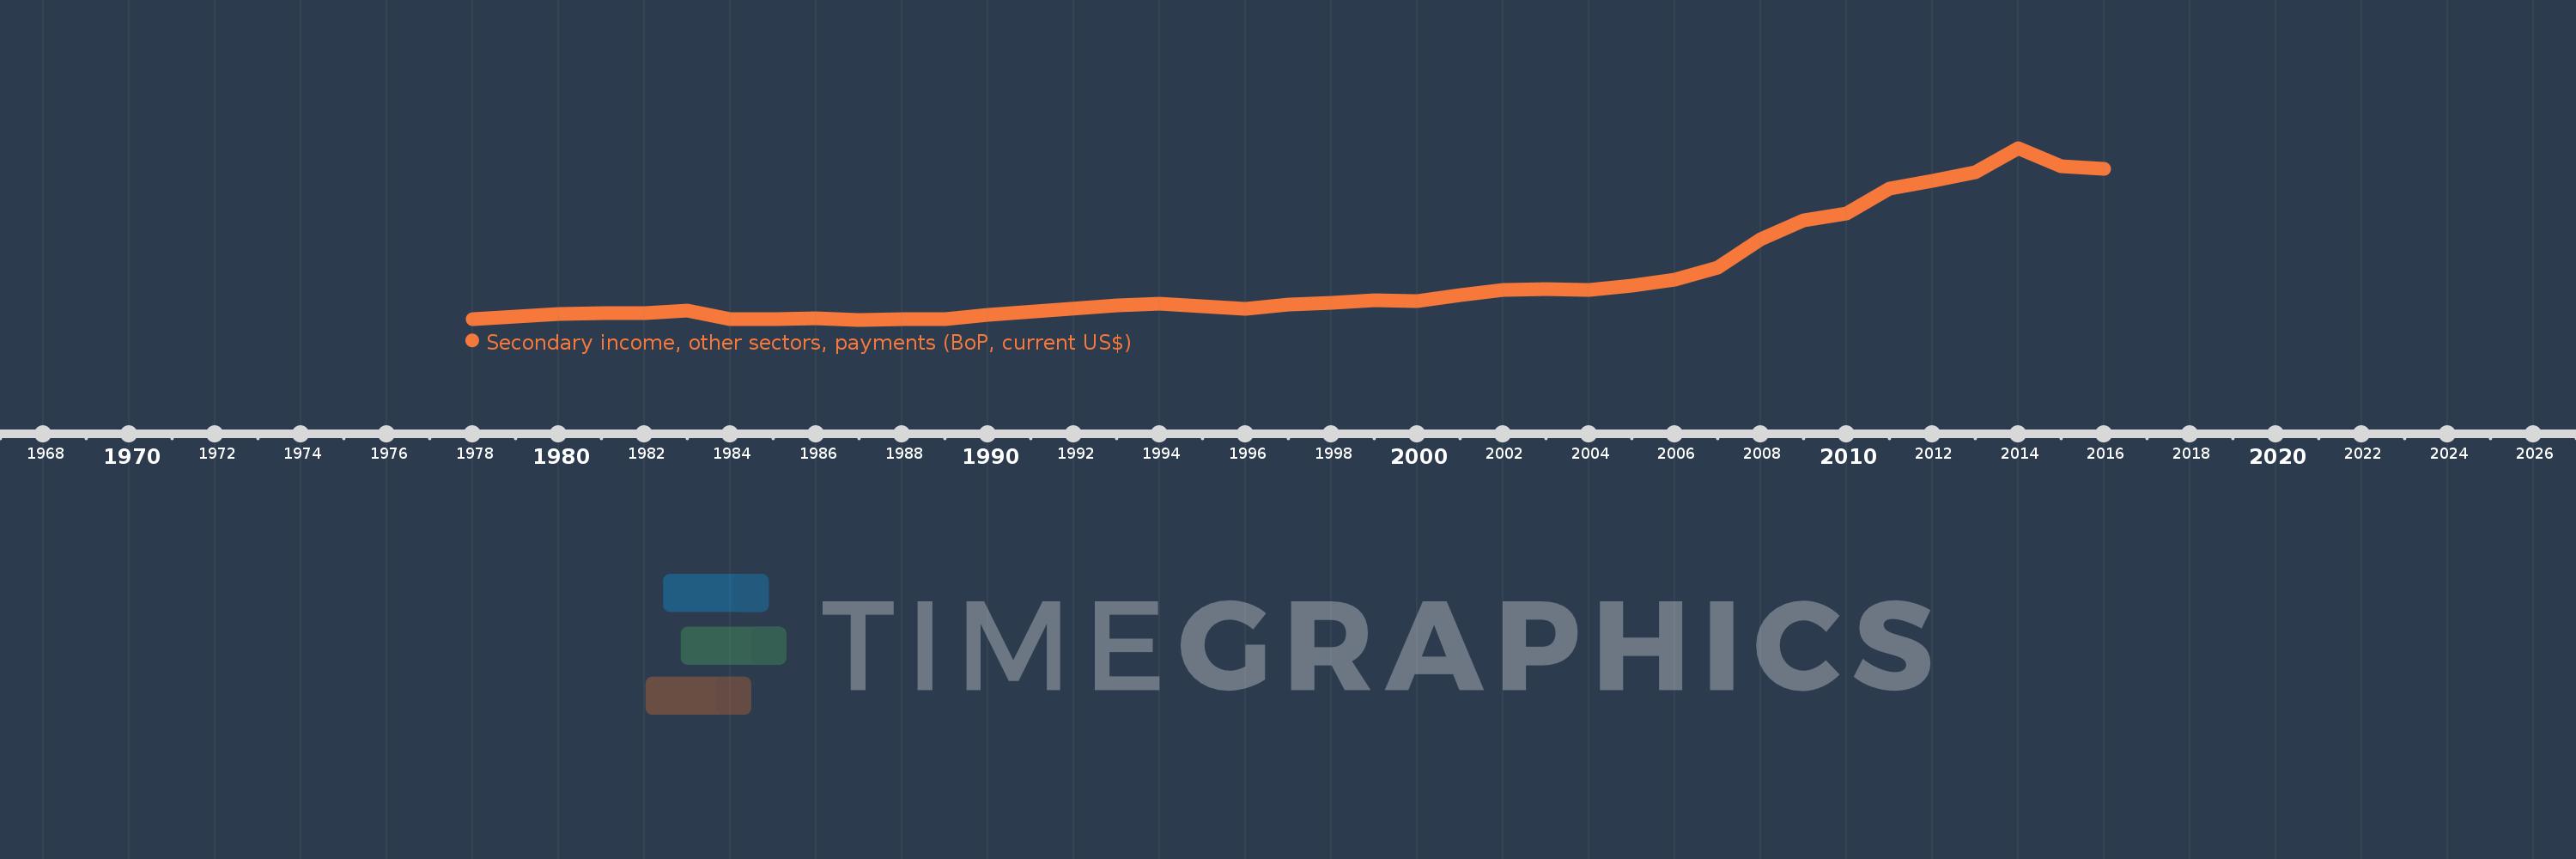
Secondary income, other sectors, payments (BoP, current US$)
2016,2015,2014,2013,2012,2011,2010,2009,2008,2007,2006,2005,2004,2003,2002,2001,2000,1999,1998,1997,1996,1995,1994,1993,1990,1989,1988,1987,1986,1985,1984,1983,1982,1981,1980,1979,1978
This statistics in other country:
AfghanistanAlbaniaAlgeriaAngolaAntigua and BarbudaArab WorldArgentinaArmeniaArubaAustraliaAustriaAzerbaijanBahamas, TheBahrainBangladeshBarbadosBelarusBelgiumBelizeBeninBermudaBhutanBoliviaBosnia and HerzegovinaBotswanaBrazilBrunei DarussalamBulgariaBurkina FasoBurundiCabo VerdeCambodiaCameroonCanadaCaribbean small statesCentral African RepublicCentral Europe and the BalticsChadChileChinaColombiaComorosCongo, Dem. Rep.Congo, Rep.Costa RicaCote d'IvoireCroatiaCuracaoCyprusCzech RepublicDenmarkDjiboutiDominicaDominican RepublicEarly-demographic dividendEast Asia & PacificEast Asia & Pacific (excluding high income)East Asia & Pacific (IDA & IBRD countries)EcuadorEgypt, Arab Rep.El SalvadorEquatorial GuineaEritreaEstoniaEthiopiaEuro areaEurope & Central AsiaEurope & Central Asia (excluding high income)Europe & Central Asia (IDA & IBRD countries)European UnionFaroe IslandsFijiFinlandFragile and conflict affected situationsFranceFrench PolynesiaGabonGambia, TheGeorgiaGermanyGhanaGreeceGrenadaGuatemalaGuineaGuinea-BissauGuyanaHaitiHeavily indebted poor countries (HIPC)High incomeHondurasHong Kong SAR, ChinaHungaryIBRD onlyIcelandIDA & IBRD totalIDA blendIDA onlyIDA totalIndiaIndonesiaIran, Islamic Rep.IraqIrelandIsraelItalyJamaicaJapanJordanKazakhstanKenyaKiribatiKorea, Rep.KosovoKuwaitKyrgyz RepublicLao PDRLate-demographic dividendLatin America & Caribbean Latin America & Caribbean (excluding high income)Latin America & the Caribbean (IDA & IBRD countries)LatviaLeast developed countries: UN classificationLebanonLesothoLiberiaLibyaLithuaniaLow & middle incomeLow incomeLower middle incomeLuxembourgMacao SAR, ChinaMacedonia, FYRMadagascarMalawiMalaysiaMaldivesMaliMaltaMarshall IslandsMauritaniaMauritiusMexicoMicronesia, Fed. Sts.Middle East & North AfricaMiddle East & North Africa (excluding high income)Middle East & North Africa (IDA & IBRD countries)Middle incomeMoldovaMongoliaMontenegroMoroccoMozambiqueMyanmarNamibiaNepalNetherlandsNew CaledoniaNew ZealandNicaraguaNigerNigeriaNorth AmericaNorwayOECD membersOmanOther small statesPacific island small statesPakistanPalauPanamaPapua New GuineaParaguayPhilippinesPolandPortugalPost-demographic dividendPre-demographic dividendQatarRomaniaRussian FederationRwandaSamoaSao Tome and PrincipeSaudi ArabiaSenegalSerbiaSeychellesSierra LeoneSingaporeSint Maarten (Dutch part)Slovak RepublicSloveniaSmall statesSolomon IslandsSouth AfricaSouth AsiaSouth Asia (IDA & IBRD)South SudanSpainSri LankaSt. Kitts and NevisSt. LuciaSt. Vincent and the GrenadinesSub-Saharan Africa Sub-Saharan Africa (excluding high income)Sub-Saharan Africa (IDA & IBRD countries)SudanSurinameSwazilandSwedenSwitzerlandSyrian Arab RepublicTajikistanTanzaniaThailandTimor-LesteTogoTongaTrinidad and TobagoTunisiaTurkeyTuvaluUgandaUkraineUnited KingdomUnited StatesUpper middle incomeUruguayVanuatuVenezuela, RBVietnamWest Bank and GazaWorldYemen, Rep.ZambiaZimbabwe Timeline:
This timeline shows a graph from 1978 to 2016 of Latin America & the Caribbean (IDA & IBRD countries). No data until 1977. Number of actual observations by date: 37.
Source name:
World Development Indicators
Source organization:
International Monetary Fund, Balance of Payments Statistics Yearbook and data files.
Categories, topics:
Economy & Growth
Last updated:
apr 23, 2017
Indicators value changes by year
Minimum:
387.686 mln
jan 1, 1987
Maximum:
13.507 bln
jan 1, 2014
At the date of observation
Value
Absolute change
Change from previous value
jan 1, 1978
438.862 mln
+438.862 mln
0.0%
jan 1, 1979
639.411 mln
+200.549 mln
45.7%
jan 1, 1980
834.185 mln
+194.774 mln
30.46%
jan 1, 1981
887.7 mln
+53.514 mln
6.42%
jan 1, 1982
908.286 mln
+20.586 mln
2.32%
jan 1, 1983
1.075 bln
+167.107 mln
18.4%
jan 1, 1984
453.315 mln
-622.077 mln
-57.85%
jan 1, 1985
456.943 mln
+3.628 mln
0.8%
jan 1, 1986
468.374 mln
+11.432 mln
2.5%
jan 1, 1987
387.686 mln
-80.688 mln
-17.23%
jan 1, 1988
447.111 mln
+59.425 mln
15.33%
jan 1, 1989
411.72 mln
-35.391 mln
-7.92%
jan 1, 1990
747.903 mln
+336.183 mln
81.65%
jan 1, 1993
1.496 bln
+747.643 mln
99.97%
jan 1, 1994
1.597 bln
+101.543 mln
6.79%
jan 1, 1995
1.446 bln
-151.446 mln
-9.48%
jan 1, 1996
1.244 bln
-201.254 mln
-13.92%
jan 1, 1997
1.517 bln
+272.632 mln
21.91%
jan 1, 1998
1.663 bln
+146.09 mln
9.63%
jan 1, 1999
1.873 bln
+210.189 mln
12.64%
jan 1, 2000
1.817 bln
-56.004 mln
-2.99%
jan 1, 2001
2.287 bln
+469.485 mln
25.83%
jan 1, 2002
2.632 bln
+345.414 mln
15.1%
jan 1, 2003
2.743 bln
+110.632 mln
4.2%
jan 1, 2004
2.636 bln
-106.826 mln
-3.89%
jan 1, 2005
2.969 bln
+332.917 mln
12.63%
jan 1, 2006
3.482 bln
+512.954 mln
17.28%
jan 1, 2007
4.349 bln
+867.267 mln
24.91%
jan 1, 2008
6.554 bln
+2.205 bln
50.69%
jan 1, 2009
7.998 bln
+1.444 bln
22.04%
jan 1, 2010
8.507 bln
+509.055 mln
6.36%
jan 1, 2011
10.404 bln
+1.897 bln
22.3%
jan 1, 2012
11.008 bln
+603.725 mln
5.8%
jan 1, 2013
11.636 bln
+627.774 mln
5.7%
jan 1, 2014
13.507 bln
+1.871 bln
16.08%
jan 1, 2015
12.105 bln
-1.402 bln
-10.38%
jan 1, 2016
11.941 bln
-163.941 mln
-1.35%
Ranking of countries by current statistics by years


Comments: