29
/
en
AIzaSyAYiBZKx7MnpbEhh9jyipgxe19OcubqV5w
April 1, 2024
190912
Mali
MLI
true
2
1
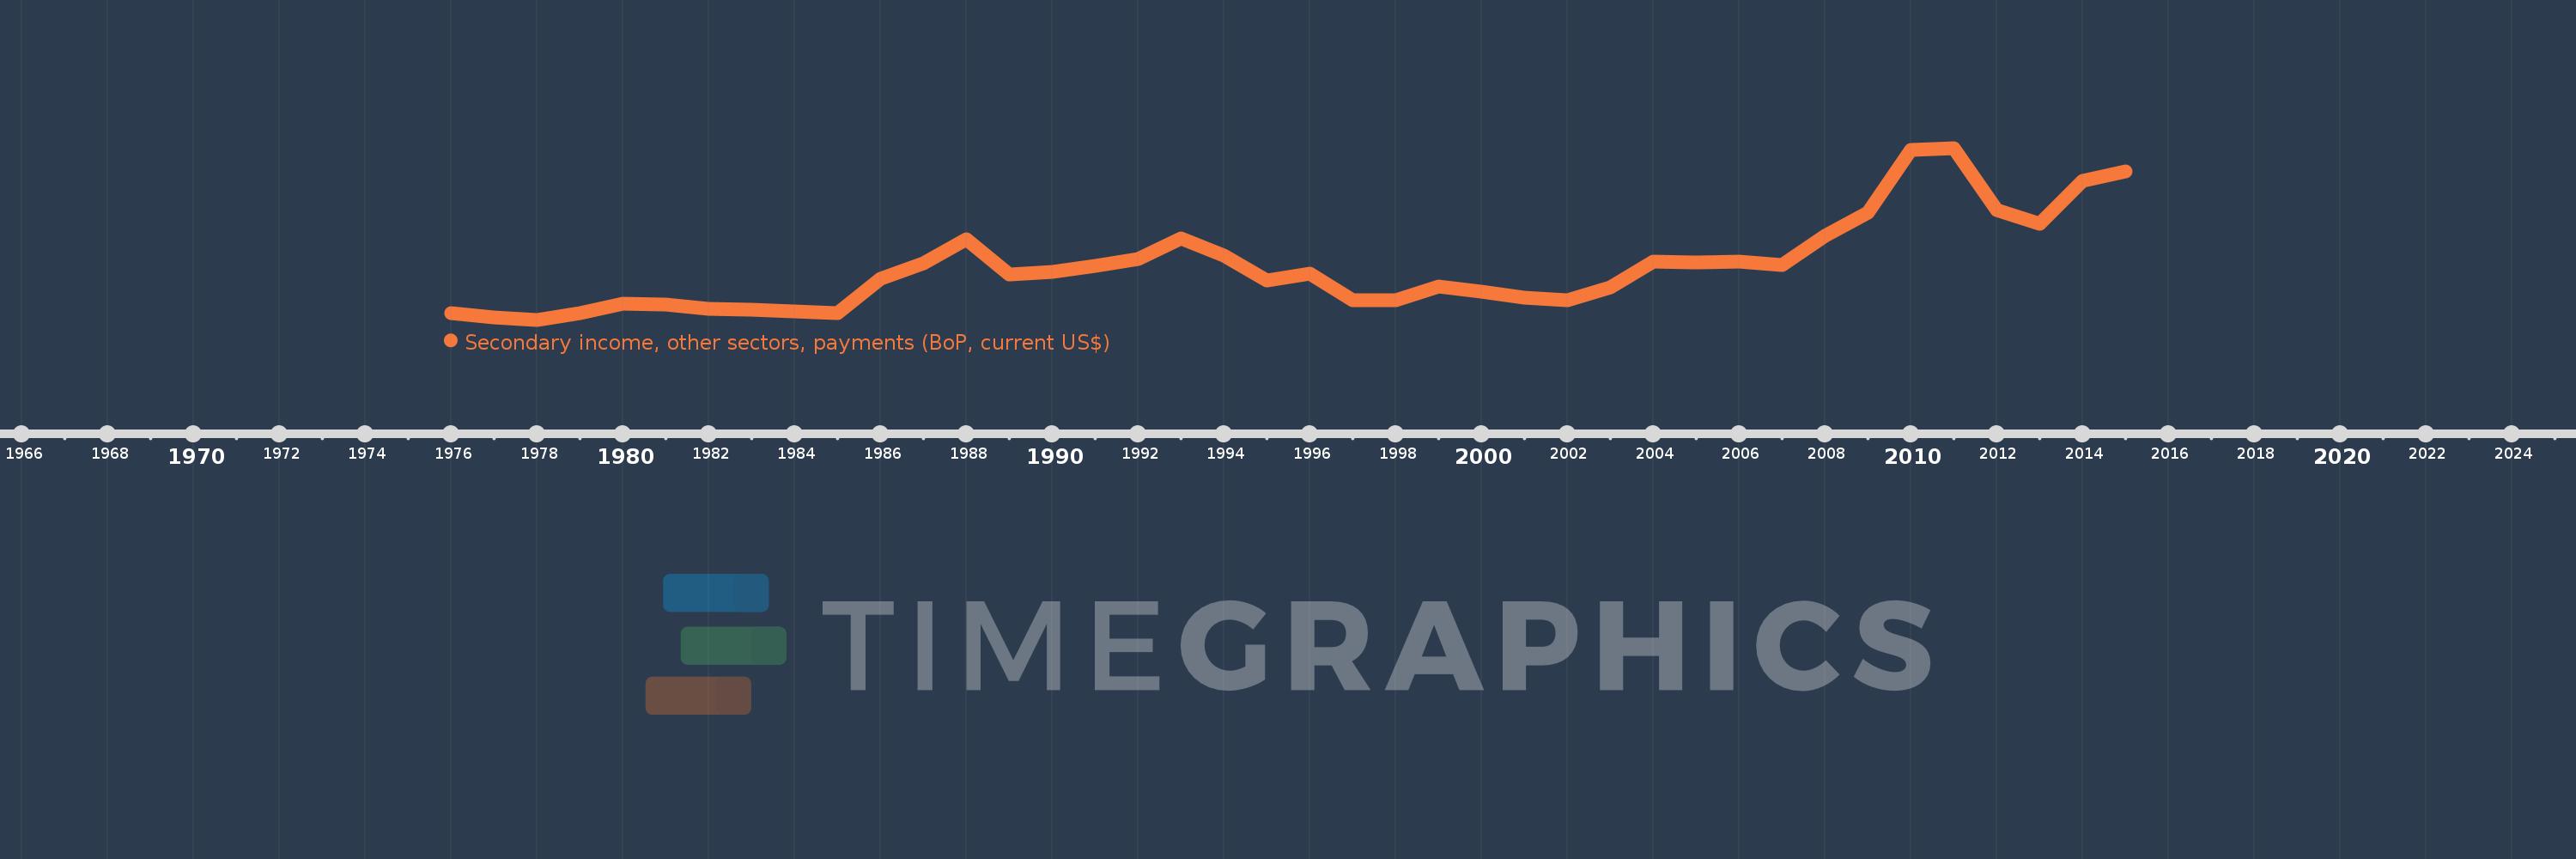
Secondary income, other sectors, payments (BoP, current US$)
2015,2014,2013,2012,2011,2010,2009,2008,2007,2006,2005,2004,2003,2002,2001,2000,1999,1998,1997,1996,1995,1994,1993,1992,1991,1990,1989,1988,1987,1986,1985,1984,1983,1982,1981,1980,1979,1978,1977,1976
This statistics in other country:
AfghanistanAlbaniaAlgeriaAngolaAntigua and BarbudaArab WorldArgentinaArmeniaArubaAustraliaAustriaAzerbaijanBahamas, TheBahrainBangladeshBarbadosBelarusBelgiumBelizeBeninBermudaBhutanBoliviaBosnia and HerzegovinaBotswanaBrazilBrunei DarussalamBulgariaBurkina FasoBurundiCabo VerdeCambodiaCameroonCanadaCaribbean small statesCentral African RepublicCentral Europe and the BalticsChadChileChinaColombiaComorosCongo, Dem. Rep.Congo, Rep.Costa RicaCote d'IvoireCroatiaCuracaoCyprusCzech RepublicDenmarkDjiboutiDominicaDominican RepublicEarly-demographic dividendEast Asia & PacificEast Asia & Pacific (excluding high income)East Asia & Pacific (IDA & IBRD countries)EcuadorEgypt, Arab Rep.El SalvadorEquatorial GuineaEritreaEstoniaEthiopiaEuro areaEurope & Central AsiaEurope & Central Asia (excluding high income)Europe & Central Asia (IDA & IBRD countries)European UnionFaroe IslandsFijiFinlandFragile and conflict affected situationsFranceFrench PolynesiaGabonGambia, TheGeorgiaGermanyGhanaGreeceGrenadaGuatemalaGuineaGuinea-BissauGuyanaHaitiHeavily indebted poor countries (HIPC)High incomeHondurasHong Kong SAR, ChinaHungaryIBRD onlyIcelandIDA & IBRD totalIDA blendIDA onlyIDA totalIndiaIndonesiaIran, Islamic Rep.IraqIrelandIsraelItalyJamaicaJapanJordanKazakhstanKenyaKiribatiKorea, Rep.KosovoKuwaitKyrgyz RepublicLao PDRLate-demographic dividendLatin America & Caribbean Latin America & Caribbean (excluding high income)Latin America & the Caribbean (IDA & IBRD countries)LatviaLeast developed countries: UN classificationLebanonLesothoLiberiaLibyaLithuaniaLow & middle incomeLow incomeLower middle incomeLuxembourgMacao SAR, ChinaMacedonia, FYRMadagascarMalawiMalaysiaMaldivesMaliMaltaMarshall IslandsMauritaniaMauritiusMexicoMicronesia, Fed. Sts.Middle East & North AfricaMiddle East & North Africa (excluding high income)Middle East & North Africa (IDA & IBRD countries)Middle incomeMoldovaMongoliaMontenegroMoroccoMozambiqueMyanmarNamibiaNepalNetherlandsNew CaledoniaNew ZealandNicaraguaNigerNigeriaNorth AmericaNorwayOECD membersOmanOther small statesPacific island small statesPakistanPalauPanamaPapua New GuineaParaguayPhilippinesPolandPortugalPost-demographic dividendPre-demographic dividendQatarRomaniaRussian FederationRwandaSamoaSao Tome and PrincipeSaudi ArabiaSenegalSerbiaSeychellesSierra LeoneSingaporeSint Maarten (Dutch part)Slovak RepublicSloveniaSmall statesSolomon IslandsSouth AfricaSouth AsiaSouth Asia (IDA & IBRD)South SudanSpainSri LankaSt. Kitts and NevisSt. LuciaSt. Vincent and the GrenadinesSub-Saharan Africa Sub-Saharan Africa (excluding high income)Sub-Saharan Africa (IDA & IBRD countries)SudanSurinameSwazilandSwedenSwitzerlandSyrian Arab RepublicTajikistanTanzaniaThailandTimor-LesteTogoTongaTrinidad and TobagoTunisiaTurkeyTuvaluUgandaUkraineUnited KingdomUnited StatesUpper middle incomeUruguayVanuatuVenezuela, RBVietnamWest Bank and GazaWorldYemen, Rep.ZambiaZimbabwe Timeline:
This timeline shows a graph from 1976 to 2015 of Mali. No data until 1975. Number of actual observations by date: 40.
Source name:
World Development Indicators
Source organization:
International Monetary Fund, Balance of Payments Statistics Yearbook and data files.
Categories, topics:
Economy & Growth
Last updated:
apr 23, 2017
Indicators value changes by year
Minimum:
6.187 mln
jan 1, 1978
Maximum:
148.644 mln
jan 1, 2011
At the date of observation
Value
Absolute change
Change from previous value
jan 1, 1976
11.735 mln
+11.735 mln
0.0%
jan 1, 1977
8.077 mln
-3.658 mln
-31.17%
jan 1, 1978
6.187 mln
-1.89 mln
-23.4%
jan 1, 1979
11.965 mln
+5.778 mln
93.39%
jan 1, 1980
19.509 mln
+7.544 mln
63.05%
jan 1, 1981
18.932 mln
-576.801K
-2.96%
jan 1, 1982
15.272 mln
-3.66 mln
-19.33%
jan 1, 1983
14.455 mln
-817.442K
-5.35%
jan 1, 1984
13.121 mln
-1.334 mln
-9.23%
jan 1, 1985
11.672 mln
-1.449 mln
-11.05%
jan 1, 1986
40.066 mln
+28.394 mln
243.27%
jan 1, 1987
53.132 mln
+13.067 mln
32.61%
jan 1, 1988
72.87 mln
+19.737 mln
37.15%
jan 1, 1989
43.445 mln
-29.425 mln
-40.38%
jan 1, 1990
45.798 mln
+2.353 mln
5.42%
jan 1, 1991
50.612 mln
+4.814 mln
10.51%
jan 1, 1992
56.362 mln
+5.749 mln
11.36%
jan 1, 1993
73.368 mln
+17.007 mln
30.17%
jan 1, 1994
59.118 mln
-14.25 mln
-19.42%
jan 1, 1995
38.49 mln
-20.628 mln
-34.89%
jan 1, 1996
44.676 mln
+6.186 mln
16.07%
jan 1, 1997
22.359 mln
-22.317 mln
-49.95%
jan 1, 1998
22.434 mln
+74.544K
0.33%
jan 1, 1999
34.011 mln
+11.577 mln
51.61%
jan 1, 2000
29.235 mln
-4.776 mln
-14.04%
jan 1, 2001
24.726 mln
-4.51 mln
-15.43%
jan 1, 2002
22.22 mln
-2.506 mln
-10.13%
jan 1, 2003
32.757 mln
+10.537 mln
47.42%
jan 1, 2004
54.093 mln
+21.337 mln
65.14%
jan 1, 2005
53.96 mln
-133.696K
-0.25%
jan 1, 2006
54.449 mln
+489.256K
0.91%
jan 1, 2007
51.349 mln
-3.1 mln
-5.69%
jan 1, 2008
75.428 mln
+24.078 mln
46.89%
jan 1, 2009
94.93 mln
+19.502 mln
25.86%
jan 1, 2010
147.082 mln
+52.152 mln
54.94%
jan 1, 2011
148.644 mln
+1.562 mln
1.06%
jan 1, 2012
97.044 mln
-51.6 mln
-34.71%
jan 1, 2013
85.94 mln
-11.105 mln
-11.44%
jan 1, 2014
121.646 mln
+35.706 mln
41.55%
jan 1, 2015
129.382 mln
+7.737 mln
6.36%
Ranking of countries by current statistics by years


Comments: