29
/
en
AIzaSyAYiBZKx7MnpbEhh9jyipgxe19OcubqV5w
April 1, 2024
91854
Brazil
BRA
true
2
1
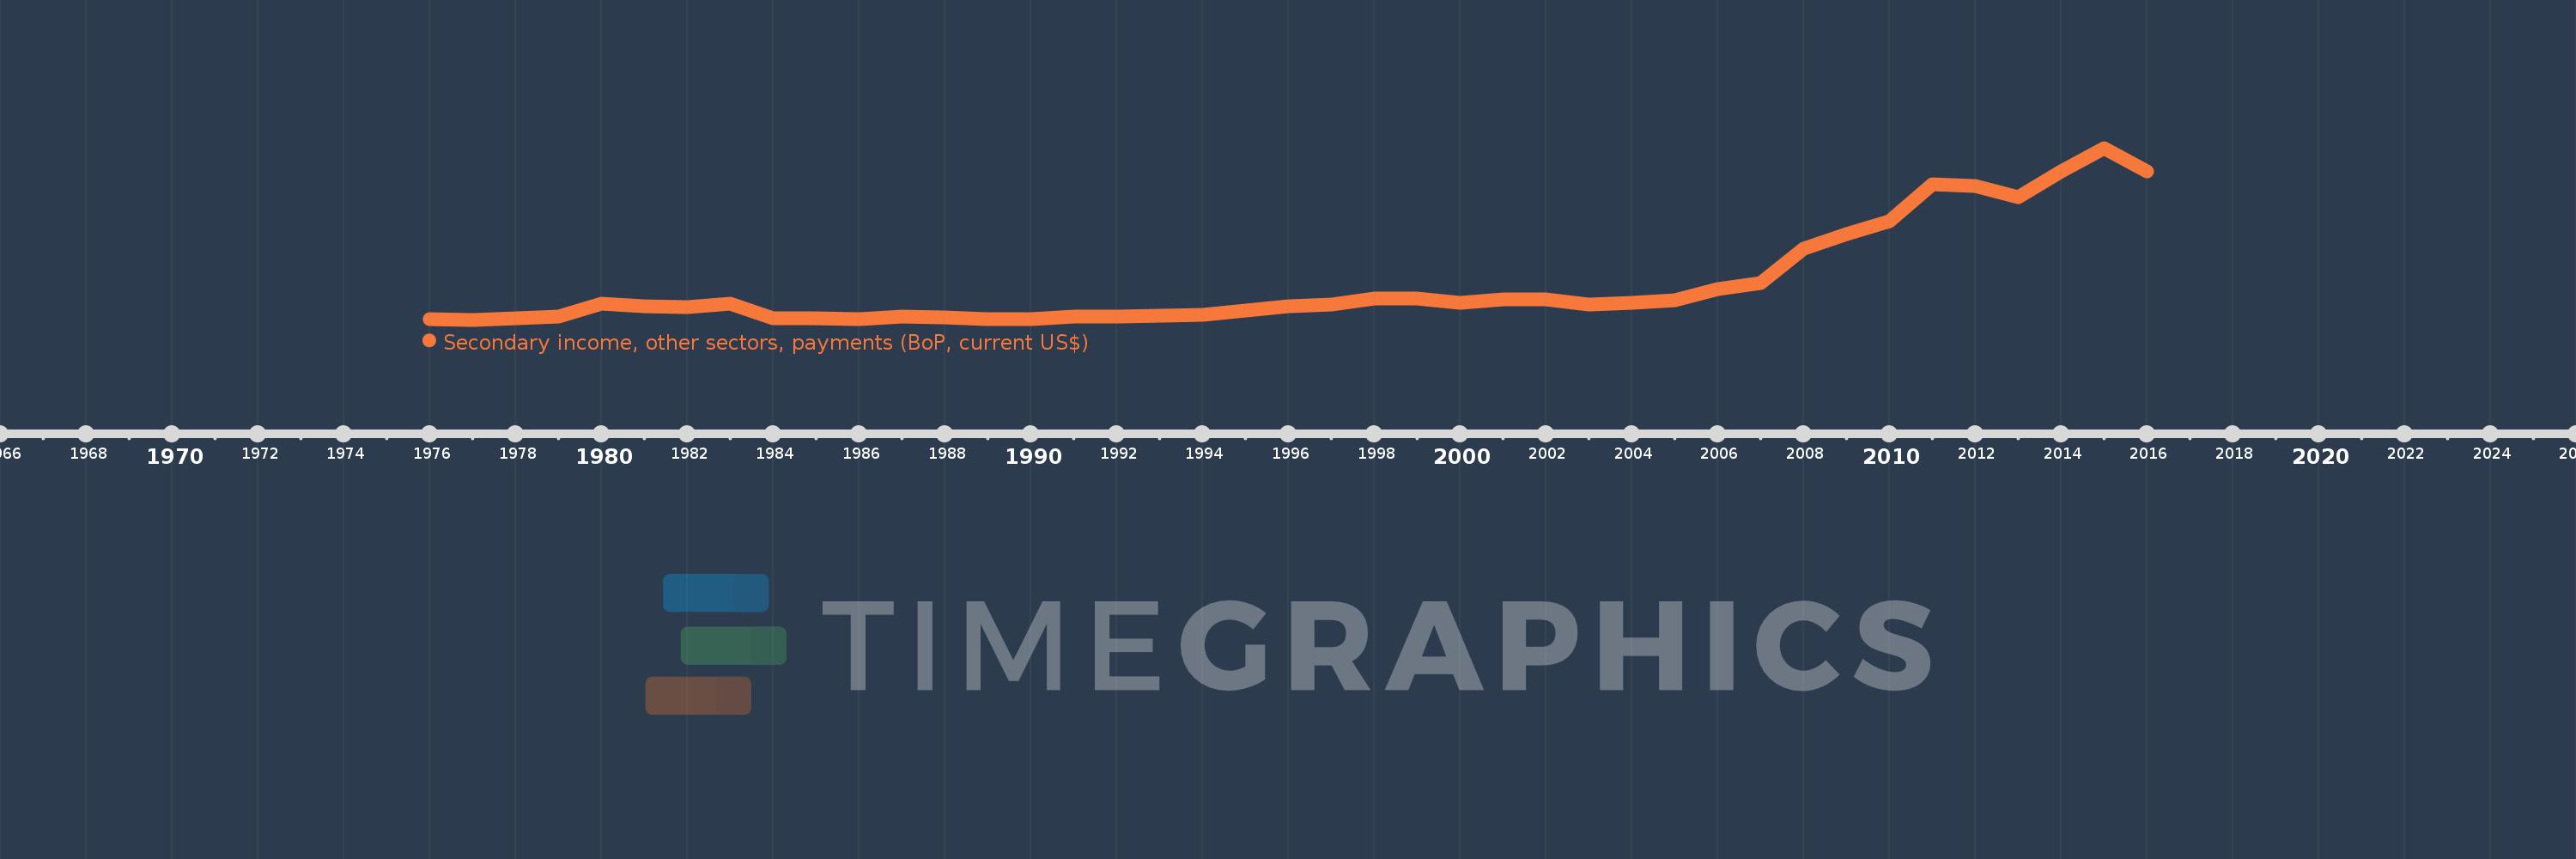
Secondary income, other sectors, payments (BoP, current US$)
2016,2015,2014,2013,2012,2011,2010,2009,2008,2007,2006,2005,2004,2003,2002,2001,2000,1999,1998,1997,1996,1995,1994,1993,1992,1991,1990,1989,1988,1987,1986,1985,1984,1983,1982,1981,1980,1979,1978,1977,1976
This statistics in other country:
AfghanistanAlbaniaAlgeriaAngolaAntigua and BarbudaArab WorldArgentinaArmeniaArubaAustraliaAustriaAzerbaijanBahamas, TheBahrainBangladeshBarbadosBelarusBelgiumBelizeBeninBermudaBhutanBoliviaBosnia and HerzegovinaBotswanaBrazilBrunei DarussalamBulgariaBurkina FasoBurundiCabo VerdeCambodiaCameroonCanadaCaribbean small statesCentral African RepublicCentral Europe and the BalticsChadChileChinaColombiaComorosCongo, Dem. Rep.Congo, Rep.Costa RicaCote d'IvoireCroatiaCuracaoCyprusCzech RepublicDenmarkDjiboutiDominicaDominican RepublicEarly-demographic dividendEast Asia & PacificEast Asia & Pacific (excluding high income)East Asia & Pacific (IDA & IBRD countries)EcuadorEgypt, Arab Rep.El SalvadorEquatorial GuineaEritreaEstoniaEthiopiaEuro areaEurope & Central AsiaEurope & Central Asia (excluding high income)Europe & Central Asia (IDA & IBRD countries)European UnionFaroe IslandsFijiFinlandFragile and conflict affected situationsFranceFrench PolynesiaGabonGambia, TheGeorgiaGermanyGhanaGreeceGrenadaGuatemalaGuineaGuinea-BissauGuyanaHaitiHeavily indebted poor countries (HIPC)High incomeHondurasHong Kong SAR, ChinaHungaryIBRD onlyIcelandIDA & IBRD totalIDA blendIDA onlyIDA totalIndiaIndonesiaIran, Islamic Rep.IraqIrelandIsraelItalyJamaicaJapanJordanKazakhstanKenyaKiribatiKorea, Rep.KosovoKuwaitKyrgyz RepublicLao PDRLate-demographic dividendLatin America & Caribbean Latin America & Caribbean (excluding high income)Latin America & the Caribbean (IDA & IBRD countries)LatviaLeast developed countries: UN classificationLebanonLesothoLiberiaLibyaLithuaniaLow & middle incomeLow incomeLower middle incomeLuxembourgMacao SAR, ChinaMacedonia, FYRMadagascarMalawiMalaysiaMaldivesMaliMaltaMarshall IslandsMauritaniaMauritiusMexicoMicronesia, Fed. Sts.Middle East & North AfricaMiddle East & North Africa (excluding high income)Middle East & North Africa (IDA & IBRD countries)Middle incomeMoldovaMongoliaMontenegroMoroccoMozambiqueMyanmarNamibiaNepalNetherlandsNew CaledoniaNew ZealandNicaraguaNigerNigeriaNorth AmericaNorwayOECD membersOmanOther small statesPacific island small statesPakistanPalauPanamaPapua New GuineaParaguayPhilippinesPolandPortugalPost-demographic dividendPre-demographic dividendQatarRomaniaRussian FederationRwandaSamoaSao Tome and PrincipeSaudi ArabiaSenegalSerbiaSeychellesSierra LeoneSingaporeSint Maarten (Dutch part)Slovak RepublicSloveniaSmall statesSolomon IslandsSouth AfricaSouth AsiaSouth Asia (IDA & IBRD)South SudanSpainSri LankaSt. Kitts and NevisSt. LuciaSt. Vincent and the GrenadinesSub-Saharan Africa Sub-Saharan Africa (excluding high income)Sub-Saharan Africa (IDA & IBRD countries)SudanSurinameSwazilandSwedenSwitzerlandSyrian Arab RepublicTajikistanTanzaniaThailandTimor-LesteTogoTongaTrinidad and TobagoTunisiaTurkeyTuvaluUgandaUkraineUnited KingdomUnited StatesUpper middle incomeUruguayVanuatuVenezuela, RBVietnamWest Bank and GazaWorldYemen, Rep.ZambiaZimbabwe Timeline:
This timeline shows a graph from 1976 to 2016 of Brazil. No data until 1975. Number of actual observations by date: 41.
Source name:
World Development Indicators
Source organization:
International Monetary Fund, Balance of Payments Statistics Yearbook and data files.
Categories, topics:
Economy & Growth
Last updated:
apr 23, 2017
Indicators value changes by year
Minimum:
4.0 mln
jan 1, 1977
Maximum:
1.964 bln
jan 1, 2015
At the date of observation
Value
Absolute change
Change from previous value
jan 1, 1976
13.0 mln
+13.0 mln
0.0%
jan 1, 1977
4.0 mln
-9.0 mln
-69.23%
jan 1, 1978
16.0 mln
+12.0 mln
300.0%
jan 1, 1979
37.0 mln
+21.0 mln
131.25%
jan 1, 1980
187.0 mln
+150.0 mln
405.41%
jan 1, 1981
158.0 mln
-29.0 mln
-15.51%
jan 1, 1982
149.0 mln
-9.0 mln
-5.7%
jan 1, 1983
190.0 mln
+41.0 mln
27.52%
jan 1, 1984
20.0 mln
-170.0 mln
-89.47%
jan 1, 1985
16.0 mln
-4.0 mln
-20.0%
jan 1, 1986
10.0 mln
-6.0 mln
-37.5%
jan 1, 1987
38.0 mln
+28.0 mln
280.0%
jan 1, 1988
30.0 mln
-8.0 mln
-21.05%
jan 1, 1989
7.0 mln
-23.0 mln
-76.67%
jan 1, 1990
10.0 mln
+3.0 mln
42.86%
jan 1, 1991
39.0 mln
+29.0 mln
290.0%
jan 1, 1992
39.0 mln
0.0
0.0%
jan 1, 1993
52.0 mln
+13.0 mln
33.33%
jan 1, 1994
64.0 mln
+12.0 mln
23.08%
jan 1, 1995
110.0 mln
+46.0 mln
71.88%
jan 1, 1996
161.0 mln
+51.0 mln
46.36%
jan 1, 1997
180.0 mln
+19.0 mln
11.8%
jan 1, 1998
242.0 mln
+62.0 mln
34.44%
jan 1, 1999
250.0 mln
+8.0 mln
3.31%
jan 1, 2000
200.0 mln
-50.0 mln
-20.0%
jan 1, 2001
233.079 mln
+33.079 mln
16.54%
jan 1, 2002
231.895 mln
-1.184 mln
-0.51%
jan 1, 2003
178.892 mln
-53.003 mln
-22.86%
jan 1, 2004
197.111 mln
+18.219 mln
10.18%
jan 1, 2005
228.137 mln
+31.026 mln
15.74%
jan 1, 2006
353.085 mln
+124.948 mln
54.77%
jan 1, 2007
419.405 mln
+66.32 mln
18.78%
jan 1, 2008
813.45 mln
+394.045 mln
93.95%
jan 1, 2009
983.276 mln
+169.826 mln
20.88%
jan 1, 2010
1.128 bln
+144.498 mln
14.7%
jan 1, 2011
1.547 bln
+418.951 mln
37.15%
jan 1, 2012
1.526 bln
-20.807 mln
-1.35%
jan 1, 2013
1.4 bln
-125.609 mln
-8.23%
jan 1, 2014
1.701 bln
+300.996 mln
21.49%
jan 1, 2015
1.964 bln
+263.156 mln
15.47%
jan 1, 2016
1.692 bln
-272.104 mln
-13.85%
Ranking of countries by current statistics by years


Comments: