29
/
en
AIzaSyAYiBZKx7MnpbEhh9jyipgxe19OcubqV5w
April 1, 2024
208431
Netherlands
NLD
true
2
1
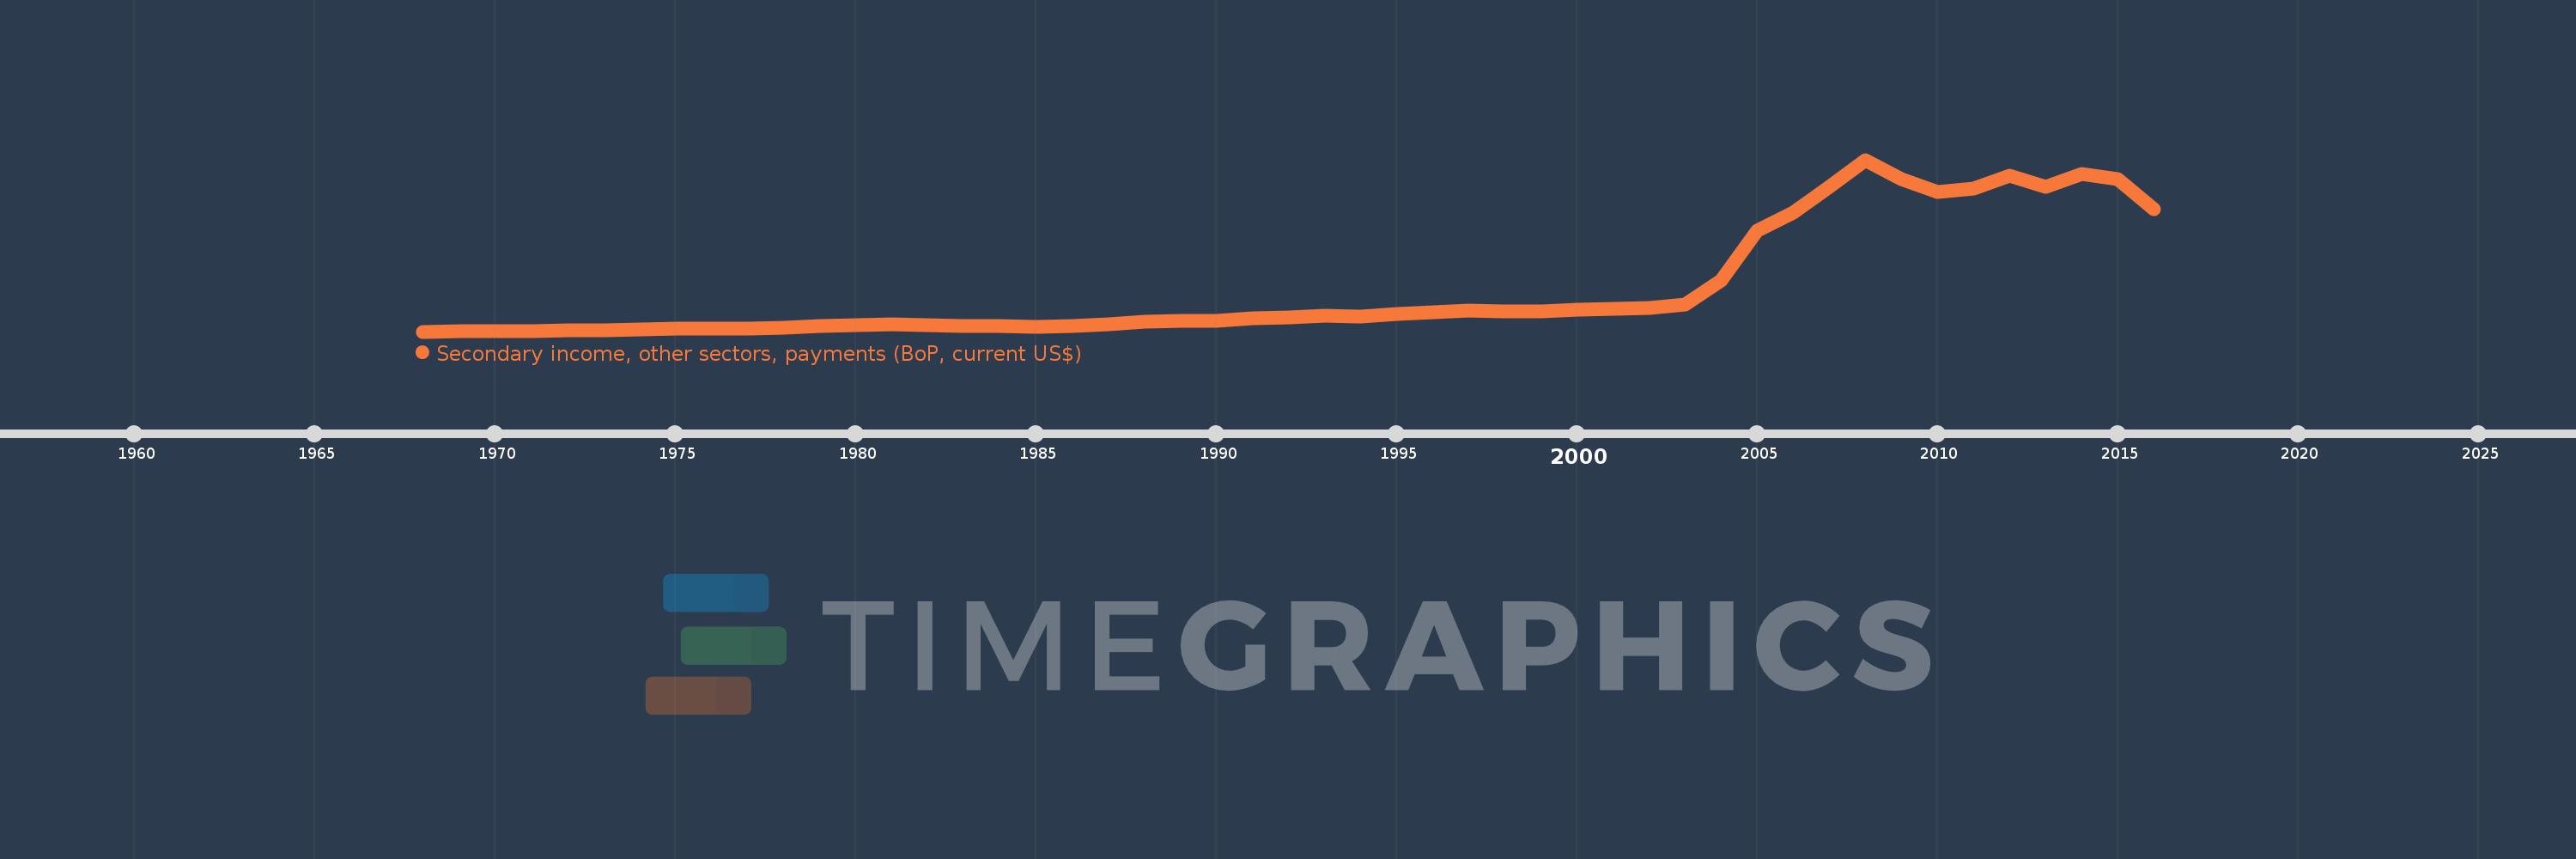
Secondary income, other sectors, payments (BoP, current US$)
2016,2015,2014,2013,2012,2011,2010,2009,2008,2007,2006,2005,2004,2003,2002,2001,2000,1999,1998,1997,1996,1995,1994,1993,1992,1991,1990,1989,1988,1987,1986,1985,1984,1983,1982,1981,1980,1979,1978,1977,1976,1975,1974,1973,1972,1971,1970,1969,1968
This statistics in other country:
AfghanistanAlbaniaAlgeriaAngolaAntigua and BarbudaArab WorldArgentinaArmeniaArubaAustraliaAustriaAzerbaijanBahamas, TheBahrainBangladeshBarbadosBelarusBelgiumBelizeBeninBermudaBhutanBoliviaBosnia and HerzegovinaBotswanaBrazilBrunei DarussalamBulgariaBurkina FasoBurundiCabo VerdeCambodiaCameroonCanadaCaribbean small statesCentral African RepublicCentral Europe and the BalticsChadChileChinaColombiaComorosCongo, Dem. Rep.Congo, Rep.Costa RicaCote d'IvoireCroatiaCuracaoCyprusCzech RepublicDenmarkDjiboutiDominicaDominican RepublicEarly-demographic dividendEast Asia & PacificEast Asia & Pacific (excluding high income)East Asia & Pacific (IDA & IBRD countries)EcuadorEgypt, Arab Rep.El SalvadorEquatorial GuineaEritreaEstoniaEthiopiaEuro areaEurope & Central AsiaEurope & Central Asia (excluding high income)Europe & Central Asia (IDA & IBRD countries)European UnionFaroe IslandsFijiFinlandFragile and conflict affected situationsFranceFrench PolynesiaGabonGambia, TheGeorgiaGermanyGhanaGreeceGrenadaGuatemalaGuineaGuinea-BissauGuyanaHaitiHeavily indebted poor countries (HIPC)High incomeHondurasHong Kong SAR, ChinaHungaryIBRD onlyIcelandIDA & IBRD totalIDA blendIDA onlyIDA totalIndiaIndonesiaIran, Islamic Rep.IraqIrelandIsraelItalyJamaicaJapanJordanKazakhstanKenyaKiribatiKorea, Rep.KosovoKuwaitKyrgyz RepublicLao PDRLate-demographic dividendLatin America & Caribbean Latin America & Caribbean (excluding high income)Latin America & the Caribbean (IDA & IBRD countries)LatviaLeast developed countries: UN classificationLebanonLesothoLiberiaLibyaLithuaniaLow & middle incomeLow incomeLower middle incomeLuxembourgMacao SAR, ChinaMacedonia, FYRMadagascarMalawiMalaysiaMaldivesMaliMaltaMarshall IslandsMauritaniaMauritiusMexicoMicronesia, Fed. Sts.Middle East & North AfricaMiddle East & North Africa (excluding high income)Middle East & North Africa (IDA & IBRD countries)Middle incomeMoldovaMongoliaMontenegroMoroccoMozambiqueMyanmarNamibiaNepalNetherlandsNew CaledoniaNew ZealandNicaraguaNigerNigeriaNorth AmericaNorwayOECD membersOmanOther small statesPacific island small statesPakistanPalauPanamaPapua New GuineaParaguayPhilippinesPolandPortugalPost-demographic dividendPre-demographic dividendQatarRomaniaRussian FederationRwandaSamoaSao Tome and PrincipeSaudi ArabiaSenegalSerbiaSeychellesSierra LeoneSingaporeSint Maarten (Dutch part)Slovak RepublicSloveniaSmall statesSolomon IslandsSouth AfricaSouth AsiaSouth Asia (IDA & IBRD)South SudanSpainSri LankaSt. Kitts and NevisSt. LuciaSt. Vincent and the GrenadinesSub-Saharan Africa Sub-Saharan Africa (excluding high income)Sub-Saharan Africa (IDA & IBRD countries)SudanSurinameSwazilandSwedenSwitzerlandSyrian Arab RepublicTajikistanTanzaniaThailandTimor-LesteTogoTongaTrinidad and TobagoTunisiaTurkeyTuvaluUgandaUkraineUnited KingdomUnited StatesUpper middle incomeUruguayVanuatuVenezuela, RBVietnamWest Bank and GazaWorldYemen, Rep.ZambiaZimbabwe Timeline:
This timeline shows a graph from 1968 to 2016 of Netherlands. No data until 1967. Number of actual observations by date: 49.
Source name:
World Development Indicators
Source organization:
International Monetary Fund, Balance of Payments Statistics Yearbook and data files.
Categories, topics:
Economy & Growth
Last updated:
apr 23, 2017
Indicators value changes by year
Minimum:
72.376 mln
jan 1, 1968
Maximum:
20.458 bln
jan 1, 2008
At the date of observation
Value
Absolute change
Change from previous value
jan 1, 1968
72.376 mln
+72.376 mln
0.0%
jan 1, 1969
79.282 mln
+6.906 mln
9.54%
jan 1, 1970
100.829 mln
+21.547 mln
27.18%
jan 1, 1971
130.387 mln
+29.558 mln
29.32%
jan 1, 1972
181.896 mln
+51.509 mln
39.5%
jan 1, 1973
228.539 mln
+46.644 mln
25.64%
jan 1, 1974
323.558 mln
+95.019 mln
41.58%
jan 1, 1975
390.337 mln
+66.778 mln
20.64%
jan 1, 1976
456.42 mln
+66.084 mln
16.93%
jan 1, 1977
464.887 mln
+8.467 mln
1.86%
jan 1, 1978
567.225 mln
+102.338 mln
22.01%
jan 1, 1979
690.615 mln
+123.39 mln
21.75%
jan 1, 1980
803.374 mln
+112.759 mln
16.33%
jan 1, 1981
989.208 mln
+185.834 mln
23.13%
jan 1, 1982
862.762 mln
-126.446 mln
-12.78%
jan 1, 1983
782.096 mln
-80.667 mln
-9.35%
jan 1, 1984
719.757 mln
-62.339 mln
-7.97%
jan 1, 1985
665.198 mln
-54.558 mln
-7.58%
jan 1, 1986
720.16 mln
+54.962 mln
8.26%
jan 1, 1987
976.432 mln
+256.272 mln
35.59%
jan 1, 1988
1.272 bln
+295.504 mln
30.26%
jan 1, 1989
1.341 bln
+69.019 mln
5.43%
jan 1, 1990
1.343 bln
+1.77 mln
0.13%
jan 1, 1991
1.607 bln
+263.956 mln
19.66%
jan 1, 1992
1.718 bln
+111.433 mln
6.94%
jan 1, 1993
1.94 bln
+221.72 mln
12.9%
jan 1, 1994
1.877 bln
-62.621 mln
-3.23%
jan 1, 1995
2.182 bln
+304.931 mln
16.24%
jan 1, 1996
2.399 bln
+216.44 mln
9.92%
jan 1, 1997
2.55 bln
+151.544 mln
6.32%
jan 1, 1998
2.475 bln
-75.505 mln
-2.96%
jan 1, 1999
2.463 bln
-12.005 mln
-0.49%
jan 1, 2000
2.706 bln
+243.253 mln
9.88%
jan 1, 2001
2.774 bln
+68.619 mln
2.54%
jan 1, 2002
2.884 bln
+109.338 mln
3.94%
jan 1, 2003
3.315 bln
+431.536 mln
14.96%
jan 1, 2004
6.171 bln
+2.856 bln
86.14%
jan 1, 2005
12.054 bln
+5.882 bln
95.32%
jan 1, 2006
14.226 bln
+2.172 bln
18.02%
jan 1, 2007
17.287 bln
+3.061 bln
21.52%
jan 1, 2008
20.458 bln
+3.171 bln
18.34%
jan 1, 2009
18.116 bln
-2.342 bln
-11.45%
jan 1, 2010
16.596 bln
-1.52 bln
-8.39%
jan 1, 2011
17.058 bln
+462.524 mln
2.79%
jan 1, 2012
18.557 bln
+1.499 bln
8.79%
jan 1, 2013
17.292 bln
-1.265 bln
-6.82%
jan 1, 2014
18.767 bln
+1.476 bln
8.54%
jan 1, 2015
18.158 bln
-609.109 mln
-3.25%
jan 1, 2016
14.595 bln
-3.563 bln
-19.62%
Ranking of countries by current statistics by years


Comments: