29
/
en
AIzaSyAYiBZKx7MnpbEhh9jyipgxe19OcubqV5w
April 1, 2024
163263
Jamaica
JAM
true
2
1
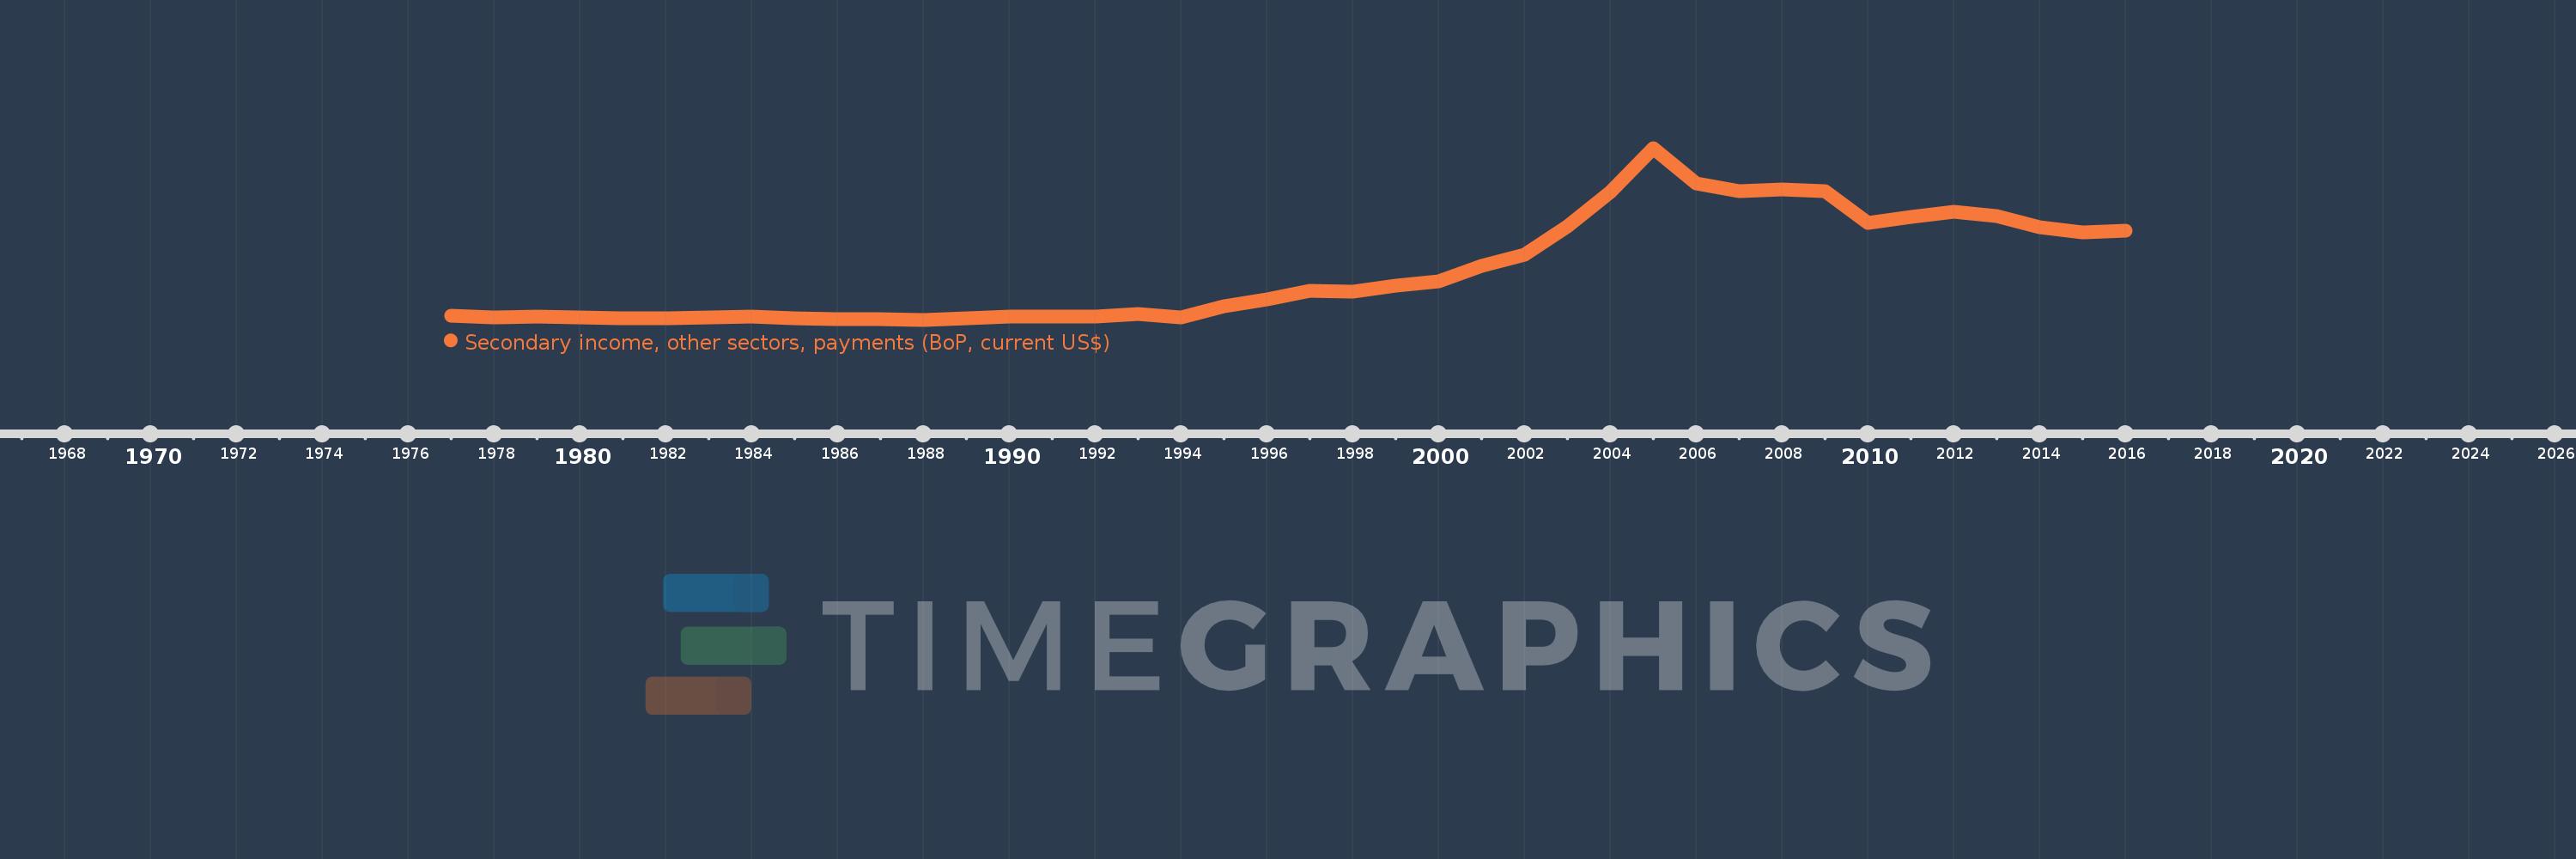
Secondary income, other sectors, payments (BoP, current US$)
2016,2015,2014,2013,2012,2011,2010,2009,2008,2007,2006,2005,2004,2003,2002,2001,2000,1999,1998,1997,1996,1995,1994,1993,1992,1991,1990,1989,1988,1987,1986,1985,1984,1983,1982,1981,1980,1979,1978,1977
This statistics in other country:
AfghanistanAlbaniaAlgeriaAngolaAntigua and BarbudaArab WorldArgentinaArmeniaArubaAustraliaAustriaAzerbaijanBahamas, TheBahrainBangladeshBarbadosBelarusBelgiumBelizeBeninBermudaBhutanBoliviaBosnia and HerzegovinaBotswanaBrazilBrunei DarussalamBulgariaBurkina FasoBurundiCabo VerdeCambodiaCameroonCanadaCaribbean small statesCentral African RepublicCentral Europe and the BalticsChadChileChinaColombiaComorosCongo, Dem. Rep.Congo, Rep.Costa RicaCote d'IvoireCroatiaCuracaoCyprusCzech RepublicDenmarkDjiboutiDominicaDominican RepublicEarly-demographic dividendEast Asia & PacificEast Asia & Pacific (excluding high income)East Asia & Pacific (IDA & IBRD countries)EcuadorEgypt, Arab Rep.El SalvadorEquatorial GuineaEritreaEstoniaEthiopiaEuro areaEurope & Central AsiaEurope & Central Asia (excluding high income)Europe & Central Asia (IDA & IBRD countries)European UnionFaroe IslandsFijiFinlandFragile and conflict affected situationsFranceFrench PolynesiaGabonGambia, TheGeorgiaGermanyGhanaGreeceGrenadaGuatemalaGuineaGuinea-BissauGuyanaHaitiHeavily indebted poor countries (HIPC)High incomeHondurasHong Kong SAR, ChinaHungaryIBRD onlyIcelandIDA & IBRD totalIDA blendIDA onlyIDA totalIndiaIndonesiaIran, Islamic Rep.IraqIrelandIsraelItalyJamaicaJapanJordanKazakhstanKenyaKiribatiKorea, Rep.KosovoKuwaitKyrgyz RepublicLao PDRLate-demographic dividendLatin America & Caribbean Latin America & Caribbean (excluding high income)Latin America & the Caribbean (IDA & IBRD countries)LatviaLeast developed countries: UN classificationLebanonLesothoLiberiaLibyaLithuaniaLow & middle incomeLow incomeLower middle incomeLuxembourgMacao SAR, ChinaMacedonia, FYRMadagascarMalawiMalaysiaMaldivesMaliMaltaMarshall IslandsMauritaniaMauritiusMexicoMicronesia, Fed. Sts.Middle East & North AfricaMiddle East & North Africa (excluding high income)Middle East & North Africa (IDA & IBRD countries)Middle incomeMoldovaMongoliaMontenegroMoroccoMozambiqueMyanmarNamibiaNepalNetherlandsNew CaledoniaNew ZealandNicaraguaNigerNigeriaNorth AmericaNorwayOECD membersOmanOther small statesPacific island small statesPakistanPalauPanamaPapua New GuineaParaguayPhilippinesPolandPortugalPost-demographic dividendPre-demographic dividendQatarRomaniaRussian FederationRwandaSamoaSao Tome and PrincipeSaudi ArabiaSenegalSerbiaSeychellesSierra LeoneSingaporeSint Maarten (Dutch part)Slovak RepublicSloveniaSmall statesSolomon IslandsSouth AfricaSouth AsiaSouth Asia (IDA & IBRD)South SudanSpainSri LankaSt. Kitts and NevisSt. LuciaSt. Vincent and the GrenadinesSub-Saharan Africa Sub-Saharan Africa (excluding high income)Sub-Saharan Africa (IDA & IBRD countries)SudanSurinameSwazilandSwedenSwitzerlandSyrian Arab RepublicTajikistanTanzaniaThailandTimor-LesteTogoTongaTrinidad and TobagoTunisiaTurkeyTuvaluUgandaUkraineUnited KingdomUnited StatesUpper middle incomeUruguayVanuatuVenezuela, RBVietnamWest Bank and GazaWorldYemen, Rep.ZambiaZimbabwe Timeline:
This timeline shows a graph from 1977 to 2016 of Jamaica. No data until 1976. Number of actual observations by date: 40.
Source name:
World Development Indicators
Source organization:
International Monetary Fund, Balance of Payments Statistics Yearbook and data files.
Categories, topics:
Economy & Growth
Last updated:
apr 23, 2017
Indicators value changes by year
Minimum:
5.5 mln
jan 1, 1988
Maximum:
442.278 mln
jan 1, 2005
At the date of observation
Value
Absolute change
Change from previous value
jan 1, 1977
15.8 mln
+15.8 mln
0.0%
jan 1, 1978
11.1 mln
-4.7 mln
-29.75%
jan 1, 1979
13.0 mln
+1.9 mln
17.12%
jan 1, 1980
12.3 mln
-700.0K
-5.38%
jan 1, 1981
9.0 mln
-3.3 mln
-26.83%
jan 1, 1982
9.4 mln
+400.0K
4.44%
jan 1, 1983
11.0 mln
+1.6 mln
17.02%
jan 1, 1984
13.8 mln
+2.8 mln
25.45%
jan 1, 1985
8.8 mln
-5.0 mln
-36.23%
jan 1, 1986
7.2 mln
-1.6 mln
-18.18%
jan 1, 1987
7.4 mln
+200.0K
2.78%
jan 1, 1988
5.5 mln
-1.9 mln
-25.68%
jan 1, 1989
9.1 mln
+3.6 mln
65.45%
jan 1, 1990
13.1 mln
+4.0 mln
43.96%
jan 1, 1991
12.9 mln
-200.0K
-1.53%
jan 1, 1992
14.3 mln
+1.4 mln
10.85%
jan 1, 1993
19.4 mln
+5.1 mln
35.66%
jan 1, 1994
11.7 mln
-7.7 mln
-39.69%
jan 1, 1995
39.3 mln
+27.6 mln
235.9%
jan 1, 1996
57.8 mln
+18.5 mln
47.07%
jan 1, 1997
78.3 mln
+20.5 mln
35.47%
jan 1, 1998
76.2 mln
-2.1 mln
-2.68%
jan 1, 1999
92.3 mln
+16.1 mln
21.13%
jan 1, 2000
102.9 mln
+10.6 mln
11.48%
jan 1, 2001
141.4 mln
+38.5 mln
37.41%
jan 1, 2002
170.0 mln
+28.6 mln
20.23%
jan 1, 2003
243.5 mln
+73.5 mln
43.24%
jan 1, 2004
329.6 mln
+86.1 mln
35.36%
jan 1, 2005
442.278 mln
+112.678 mln
34.19%
jan 1, 2006
352.211 mln
-90.066 mln
-20.36%
jan 1, 2007
333.167 mln
-19.044 mln
-5.41%
jan 1, 2008
337.482 mln
+4.315 mln
1.29%
jan 1, 2009
332.519 mln
-4.963 mln
-1.47%
jan 1, 2010
251.616 mln
-80.902 mln
-24.33%
jan 1, 2011
267.241 mln
+15.624 mln
6.21%
jan 1, 2012
279.813 mln
+12.572 mln
4.7%
jan 1, 2013
268.159 mln
-11.654 mln
-4.16%
jan 1, 2014
240.676 mln
-27.483 mln
-10.25%
jan 1, 2015
227.666 mln
-13.01 mln
-5.41%
jan 1, 2016
232.937 mln
+5.27 mln
2.31%
Ranking of countries by current statistics by years


Comments: