29
/pt/
pt
AIzaSyAYiBZKx7MnpbEhh9jyipgxe19OcubqV5w
April 1, 2024
92052
British Virgin Islands
VGB
true
2
1
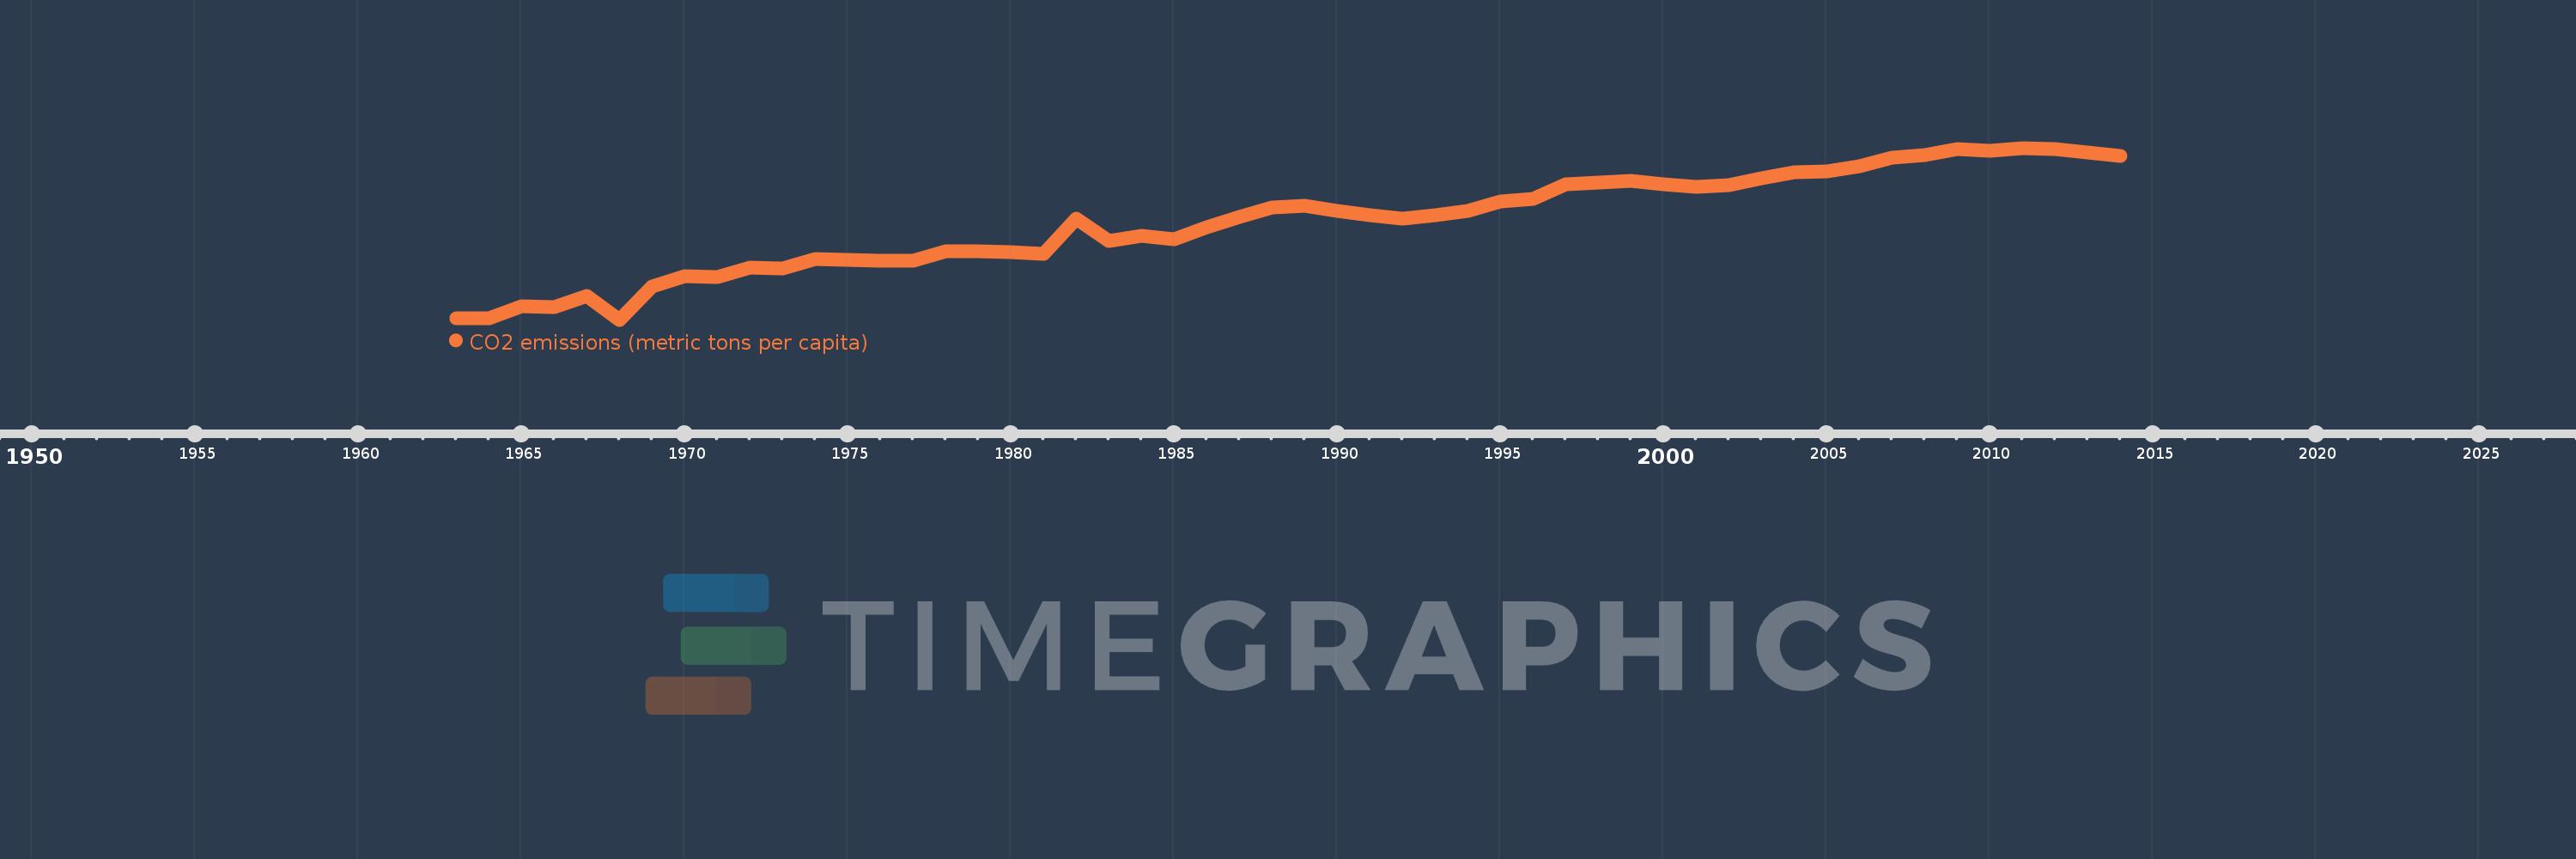
CO2 emissions (metric tons per capita)
2014,2013,2012,2011,2010,2009,2008,2007,2006,2005,2004,2003,2002,2001,2000,1999,1998,1997,1996,1995,1994,1993,1992,1991,1990,1989,1988,1987,1986,1985,1984,1983,1982,1981,1980,1979,1978,1977,1976,1975,1974,1973,1972,1971,1970,1969,1968,1967,1966,1965,1964,1963
Estas estatísticas em outros países:
AfghanistanAlbaniaAlgeriaAndorraAngolaAntigua and BarbudaArab WorldArgentinaArmeniaArubaAustraliaAustriaAzerbaijanBahamas, TheBahrainBangladeshBarbadosBelarusBelgiumBelizeBeninBermudaBhutanBoliviaBosnia and HerzegovinaBotswanaBrazilBritish Virgin IslandsBrunei DarussalamBulgariaBurkina FasoBurundiCabo VerdeCambodiaCameroonCanadaCaribbean small statesCayman IslandsCentral African RepublicCentral Europe and the BalticsChadChileChinaColombiaComorosCongo, Dem. Rep.Congo, Rep.Costa RicaCote d'IvoireCroatiaCubaCuracaoCyprusCzech RepublicDenmarkDjiboutiDominicaDominican RepublicEarly-demographic dividendEast Asia & PacificEast Asia & Pacific (excluding high income)East Asia & Pacific (IDA & IBRD countries)EcuadorEgypt, Arab Rep.El SalvadorEquatorial GuineaEritreaEstoniaEthiopiaEuro areaEurope & Central AsiaEurope & Central Asia (excluding high income)Europe & Central Asia (IDA & IBRD countries)European UnionFaroe IslandsFijiFinlandFragile and conflict affected situationsFranceFrench PolynesiaGabonGambia, TheGeorgiaGermanyGhanaGibraltarGreeceGreenlandGrenadaGuatemalaGuineaGuinea-BissauGuyanaHaitiHeavily indebted poor countries (HIPC)High incomeHondurasHong Kong SAR, ChinaHungaryIBRD onlyIcelandIDA & IBRD totalIDA blendIDA onlyIDA totalIndiaIndonesiaIran, Islamic Rep.IraqIrelandIsraelItalyJamaicaJapanJordanKazakhstanKenyaKiribatiKorea, Dem. People’s Rep.Korea, Rep.KuwaitKyrgyz RepublicLao PDRLate-demographic dividendLatin America & Caribbean Latin America & Caribbean (excluding high income)Latin America & the Caribbean (IDA & IBRD countries)LatviaLeast developed countries: UN classificationLebanonLesothoLiberiaLibyaLiechtensteinLithuaniaLow & middle incomeLow incomeLower middle incomeLuxembourgMacao SAR, ChinaMacedonia, FYRMadagascarMalawiMalaysiaMaldivesMaliMaltaMarshall IslandsMauritaniaMauritiusMexicoMicronesia, Fed. Sts.Middle East & North AfricaMiddle East & North Africa (excluding high income)Middle East & North Africa (IDA & IBRD countries)Middle incomeMoldovaMongoliaMontenegroMoroccoMozambiqueMyanmarNamibiaNauruNepalNetherlandsNew CaledoniaNew ZealandNicaraguaNigerNigeriaNorth AmericaNorwayOECD membersOmanOther small statesPacific island small statesPakistanPalauPanamaPapua New GuineaParaguayPeruPhilippinesPolandPortugalPost-demographic dividendPre-demographic dividendQatarRomaniaRussian FederationRwandaSamoaSao Tome and PrincipeSaudi ArabiaSenegalSerbiaSeychellesSierra LeoneSingaporeSint Maarten (Dutch part)Slovak RepublicSloveniaSmall statesSolomon IslandsSomaliaSouth AfricaSouth AsiaSouth Asia (IDA & IBRD)South SudanSpainSri LankaSt. Kitts and NevisSt. LuciaSt. Vincent and the GrenadinesSub-Saharan Africa Sub-Saharan Africa (excluding high income)Sub-Saharan Africa (IDA & IBRD countries)SudanSurinameSwazilandSwedenSwitzerlandSyrian Arab RepublicTajikistanTanzaniaThailandTimor-LesteTogoTongaTrinidad and TobagoTunisiaTurkeyTurkmenistanTurks and Caicos IslandsUgandaUkraineUnited Arab EmiratesUnited KingdomUnited StatesUpper middle incomeUruguayUzbekistanVanuatuVenezuela, RBVietnamWest Bank and GazaWorldYemen, Rep.ZambiaZimbabwe Linha do tempo:
Nesta escala de tempo está apresentado um gráfico de 1963 ano até 2014 ano British Virgin Islands. Dados de 1962 ano ausente. O número de observações reais por data: 52.
Fonte (nome):
Indicadores de desenvolvimento mundial
Fonte (organização):
Carbon Dioxide Information Analysis Center, Environmental Sciences Division, Oak Ridge National Laboratory, Tennessee, United States.
Categorias:
Climate Change, Environment
Foi atualizado:
23 abr 2017 ano
Indicadores de alterações dos valores ao longo dos anos
Mínimo:
0.398
1 jan 1968 ano
Máximo:
6.331
1 jan 2011 ano
Na data de observação
Valor
Mudança absoluta
A alteração em relação ao valor anterior
1 jan 1963 ano
0.442
+0.442
0.0%
1 jan 1964 ano
0.434
-0.008
-1.86%
1 jan 1965 ano
0.85
+0.416
95.99%
1 jan 1966 ano
0.832
-0.018
-2.1%
1 jan 1967 ano
1.221
+0.389
46.74%
1 jan 1968 ano
0.398
-0.823
-67.41%
1 jan 1969 ano
1.557
+1.159
291.17%
1 jan 1970 ano
1.906
+0.349
22.43%
1 jan 1971 ano
1.871
-0.035
-1.86%
1 jan 1972 ano
2.207
+0.337
17.99%
1 jan 1973 ano
2.173
-0.034
-1.54%
1 jan 1974 ano
2.501
+0.328
15.1%
1 jan 1975 ano
2.473
-0.028
-1.13%
1 jan 1976 ano
2.45
-0.023
-0.92%
1 jan 1977 ano
2.434
-0.016
-0.64%
1 jan 1978 ano
2.769
+0.334
13.72%
1 jan 1979 ano
2.751
-0.017
-0.63%
1 jan 1980 ano
2.719
-0.032
-1.16%
1 jan 1981 ano
2.666
-0.053
-1.95%
1 jan 1982 ano
3.889
+1.222
45.85%
1 jan 1983 ano
3.13
-0.758
-19.5%
1 jan 1984 ano
3.308
+0.178
5.7%
1 jan 1985 ano
3.169
-0.14
-4.22%
1 jan 1986 ano
3.582
+0.413
13.04%
1 jan 1987 ano
3.948
+0.366
10.22%
1 jan 1988 ano
4.271
+0.323
8.18%
1 jan 1989 ano
4.324
+0.053
1.24%
1 jan 1990 ano
4.152
-0.172
-3.97%
1 jan 1991 ano
4.01
-0.142
-3.42%
1 jan 1992 ano
3.897
-0.113
-2.82%
1 jan 1993 ano
4.017
+0.12
3.08%
1 jan 1994 ano
4.144
+0.126
3.14%
1 jan 1995 ano
4.469
+0.326
7.86%
1 jan 1996 ano
4.578
+0.108
2.42%
1 jan 1997 ano
5.062
+0.485
10.59%
1 jan 1998 ano
5.138
+0.076
1.5%
1 jan 1999 ano
5.205
+0.067
1.31%
1 jan 2000 ano
5.086
-0.119
-2.28%
1 jan 2001 ano
4.974
-0.113
-2.21%
1 jan 2002 ano
5.043
+0.069
1.39%
1 jan 2003 ano
5.28
+0.237
4.7%
1 jan 2004 ano
5.5
+0.221
4.18%
1 jan 2005 ano
5.532
+0.031
0.57%
1 jan 2006 ano
5.698
+0.166
3.0%
1 jan 2007 ano
5.982
+0.284
4.98%
1 jan 2008 ano
6.078
+0.097
1.61%
1 jan 2009 ano
6.302
+0.223
3.67%
1 jan 2010 ano
6.239
-0.063
-1.0%
1 jan 2011 ano
6.331
+0.092
1.48%
1 jan 2012 ano
6.307
-0.024
-0.37%
1 jan 2013 ano
6.174
-0.134
-2.12%
1 jan 2014 ano
6.057
-0.116
-1.88%
Classificação de países por estatísticas atuais por anos


Comentários: