29
/pt/
pt
AIzaSyAYiBZKx7MnpbEhh9jyipgxe19OcubqV5w
April 1, 2024
125916
El Salvador
SLV
true
2
1
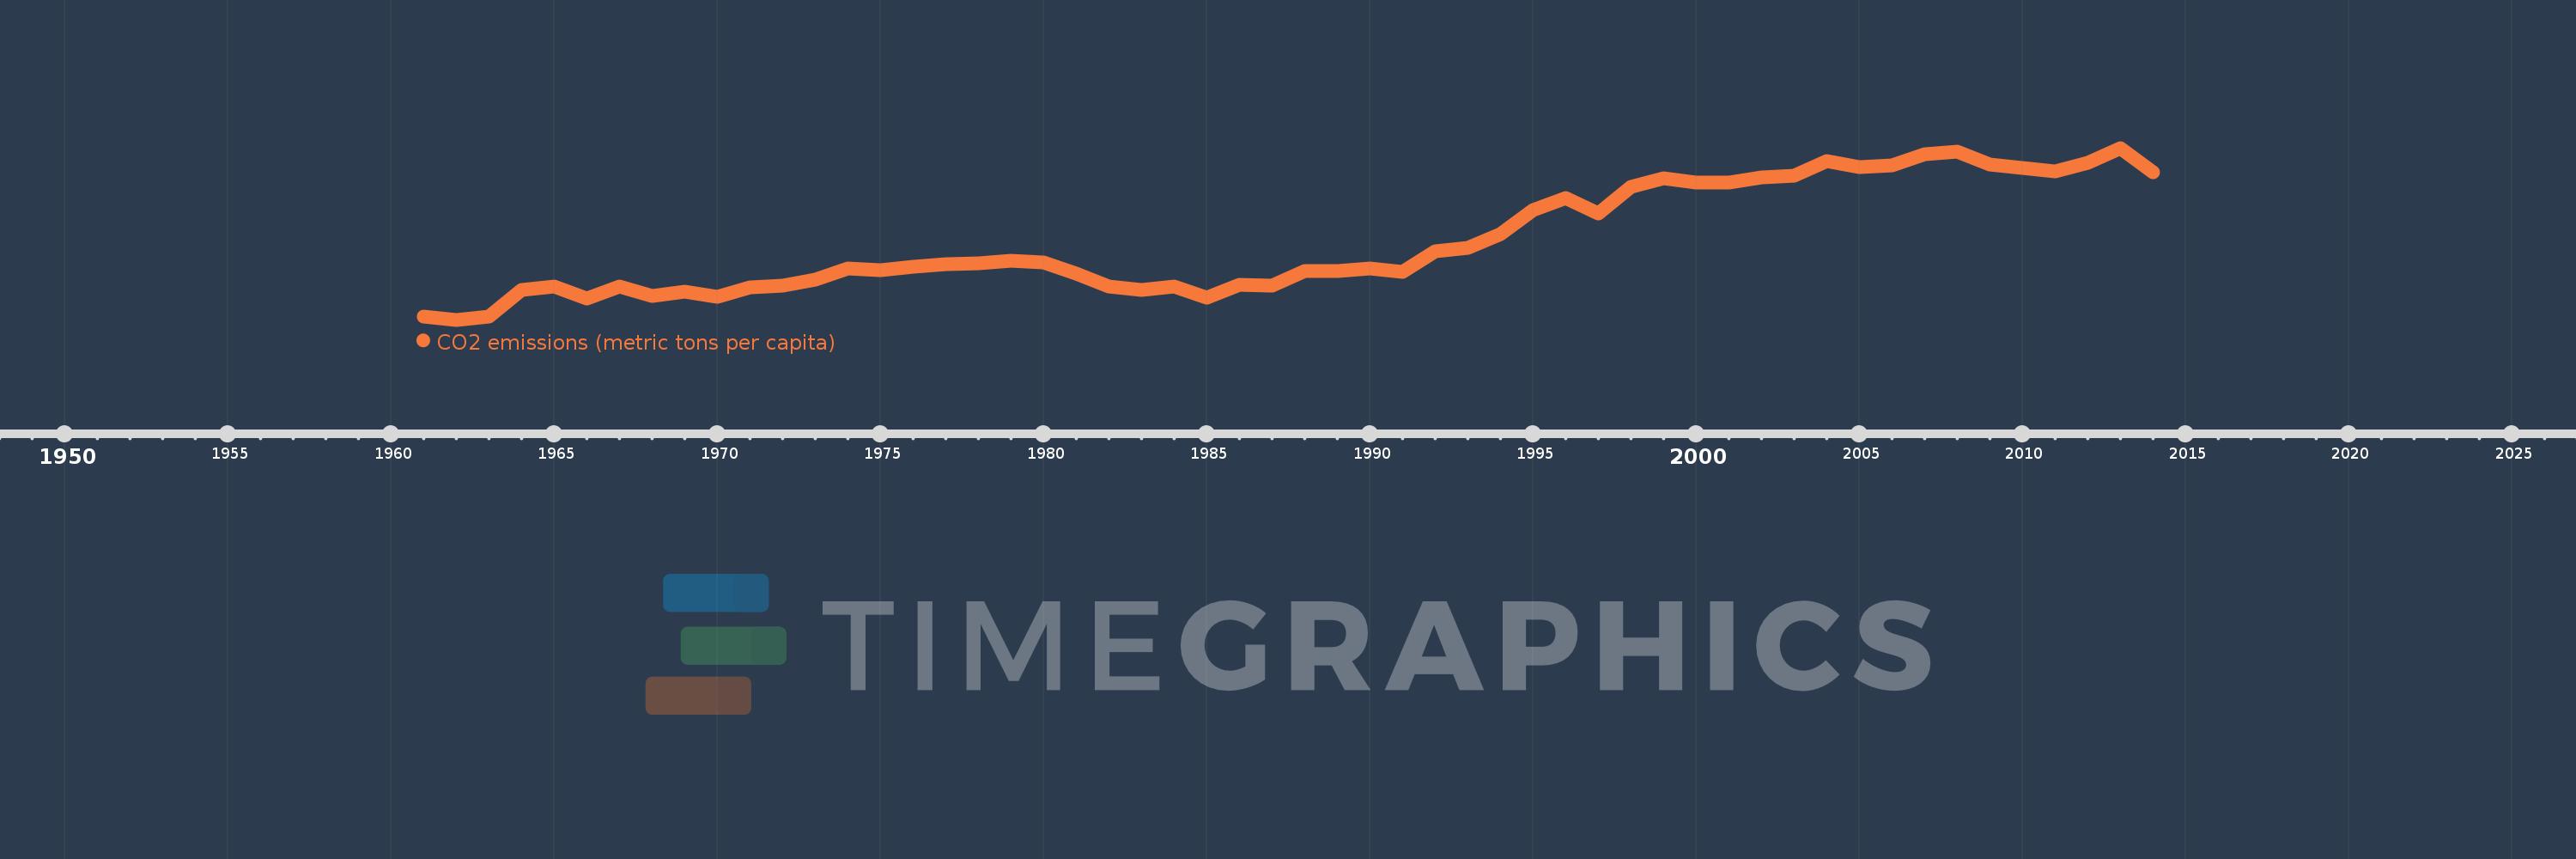
CO2 emissions (metric tons per capita)
2014,2013,2012,2011,2010,2009,2008,2007,2006,2005,2004,2003,2002,2001,2000,1999,1998,1997,1996,1995,1994,1993,1992,1991,1990,1989,1988,1987,1986,1985,1984,1983,1982,1981,1980,1979,1978,1977,1976,1975,1974,1973,1972,1971,1970,1969,1968,1967,1966,1965,1964,1963,1962,1961
Estas estatísticas em outros países:
AfghanistanAlbaniaAlgeriaAndorraAngolaAntigua and BarbudaArab WorldArgentinaArmeniaArubaAustraliaAustriaAzerbaijanBahamas, TheBahrainBangladeshBarbadosBelarusBelgiumBelizeBeninBermudaBhutanBoliviaBosnia and HerzegovinaBotswanaBrazilBritish Virgin IslandsBrunei DarussalamBulgariaBurkina FasoBurundiCabo VerdeCambodiaCameroonCanadaCaribbean small statesCayman IslandsCentral African RepublicCentral Europe and the BalticsChadChileChinaColombiaComorosCongo, Dem. Rep.Congo, Rep.Costa RicaCote d'IvoireCroatiaCubaCuracaoCyprusCzech RepublicDenmarkDjiboutiDominicaDominican RepublicEarly-demographic dividendEast Asia & PacificEast Asia & Pacific (excluding high income)East Asia & Pacific (IDA & IBRD countries)EcuadorEgypt, Arab Rep.El SalvadorEquatorial GuineaEritreaEstoniaEthiopiaEuro areaEurope & Central AsiaEurope & Central Asia (excluding high income)Europe & Central Asia (IDA & IBRD countries)European UnionFaroe IslandsFijiFinlandFragile and conflict affected situationsFranceFrench PolynesiaGabonGambia, TheGeorgiaGermanyGhanaGibraltarGreeceGreenlandGrenadaGuatemalaGuineaGuinea-BissauGuyanaHaitiHeavily indebted poor countries (HIPC)High incomeHondurasHong Kong SAR, ChinaHungaryIBRD onlyIcelandIDA & IBRD totalIDA blendIDA onlyIDA totalIndiaIndonesiaIran, Islamic Rep.IraqIrelandIsraelItalyJamaicaJapanJordanKazakhstanKenyaKiribatiKorea, Dem. People’s Rep.Korea, Rep.KuwaitKyrgyz RepublicLao PDRLate-demographic dividendLatin America & Caribbean Latin America & Caribbean (excluding high income)Latin America & the Caribbean (IDA & IBRD countries)LatviaLeast developed countries: UN classificationLebanonLesothoLiberiaLibyaLiechtensteinLithuaniaLow & middle incomeLow incomeLower middle incomeLuxembourgMacao SAR, ChinaMacedonia, FYRMadagascarMalawiMalaysiaMaldivesMaliMaltaMarshall IslandsMauritaniaMauritiusMexicoMicronesia, Fed. Sts.Middle East & North AfricaMiddle East & North Africa (excluding high income)Middle East & North Africa (IDA & IBRD countries)Middle incomeMoldovaMongoliaMontenegroMoroccoMozambiqueMyanmarNamibiaNauruNepalNetherlandsNew CaledoniaNew ZealandNicaraguaNigerNigeriaNorth AmericaNorwayOECD membersOmanOther small statesPacific island small statesPakistanPalauPanamaPapua New GuineaParaguayPeruPhilippinesPolandPortugalPost-demographic dividendPre-demographic dividendQatarRomaniaRussian FederationRwandaSamoaSao Tome and PrincipeSaudi ArabiaSenegalSerbiaSeychellesSierra LeoneSingaporeSint Maarten (Dutch part)Slovak RepublicSloveniaSmall statesSolomon IslandsSomaliaSouth AfricaSouth AsiaSouth Asia (IDA & IBRD)South SudanSpainSri LankaSt. Kitts and NevisSt. LuciaSt. Vincent and the GrenadinesSub-Saharan Africa Sub-Saharan Africa (excluding high income)Sub-Saharan Africa (IDA & IBRD countries)SudanSurinameSwazilandSwedenSwitzerlandSyrian Arab RepublicTajikistanTanzaniaThailandTimor-LesteTogoTongaTrinidad and TobagoTunisiaTurkeyTurkmenistanTurks and Caicos IslandsUgandaUkraineUnited Arab EmiratesUnited KingdomUnited StatesUpper middle incomeUruguayUzbekistanVanuatuVenezuela, RBVietnamWest Bank and GazaWorldYemen, Rep.ZambiaZimbabwe Linha do tempo:
Nesta escala de tempo está apresentado um gráfico de 1961 ano até 2014 ano El Salvador. Dados de 1960 ano ausente. O número de observações reais por data: 54.
Fonte (nome):
Indicadores de desenvolvimento mundial
Fonte (organização):
Carbon Dioxide Information Analysis Center, Environmental Sciences Division, Oak Ridge National Laboratory, Tennessee, United States.
Categorias:
Climate Change, Environment
Foi atualizado:
23 abr 2017 ano
Indicadores de alterações dos valores ao longo dos anos
Mínimo:
0.205
1 jan 1962 ano
Máximo:
1.185
1 jan 2013 ano
Na data de observação
Valor
Mudança absoluta
A alteração em relação ao valor anterior
1 jan 1961 ano
0.224
+0.224
0.0%
1 jan 1962 ano
0.205
-0.019
-8.58%
1 jan 1963 ano
0.222
+0.017
8.1%
1 jan 1964 ano
0.373
+0.152
68.38%
1 jan 1965 ano
0.397
+0.023
6.26%
1 jan 1966 ano
0.326
-0.071
-17.9%
1 jan 1967 ano
0.397
+0.071
21.83%
1 jan 1968 ano
0.342
-0.054
-13.68%
1 jan 1969 ano
0.363
+0.02
5.92%
1 jan 1970 ano
0.334
-0.029
-8.03%
1 jan 1971 ano
0.39
+0.056
16.86%
1 jan 1972 ano
0.401
+0.011
2.93%
1 jan 1973 ano
0.435
+0.034
8.38%
1 jan 1974 ano
0.497
+0.063
14.39%
1 jan 1975 ano
0.487
-0.011
-2.17%
1 jan 1976 ano
0.508
+0.022
4.47%
1 jan 1977 ano
0.522
+0.013
2.6%
1 jan 1978 ano
0.529
+0.007
1.34%
1 jan 1979 ano
0.541
+0.013
2.43%
1 jan 1980 ano
0.531
-0.01
-1.85%
1 jan 1981 ano
0.466
-0.065
-12.28%
1 jan 1982 ano
0.394
-0.072
-15.46%
1 jan 1983 ano
0.374
-0.02
-5.03%
1 jan 1984 ano
0.397
+0.023
6.17%
1 jan 1985 ano
0.331
-0.067
-16.75%
1 jan 1986 ano
0.404
+0.073
22.09%
1 jan 1987 ano
0.399
-0.005
-1.13%
1 jan 1988 ano
0.485
+0.086
21.43%
1 jan 1989 ano
0.483
-0.002
-0.4%
1 jan 1990 ano
0.499
+0.016
3.4%
1 jan 1991 ano
0.478
-0.021
-4.23%
1 jan 1992 ano
0.596
+0.118
24.63%
1 jan 1993 ano
0.615
+0.019
3.26%
1 jan 1994 ano
0.695
+0.079
12.91%
1 jan 1995 ano
0.831
+0.136
19.61%
1 jan 1996 ano
0.9
+0.068
8.23%
1 jan 1997 ano
0.81
-0.09
-10.0%
1 jan 1998 ano
0.962
+0.152
18.79%
1 jan 1999 ano
1.013
+0.051
5.35%
1 jan 2000 ano
0.987
-0.027
-2.63%
1 jan 2001 ano
0.988
+0.001
0.14%
1 jan 2002 ano
1.018
+0.03
2.99%
1 jan 2003 ano
1.028
+0.01
1.03%
1 jan 2004 ano
1.11
+0.082
8.01%
1 jan 2005 ano
1.074
-0.036
-3.25%
1 jan 2006 ano
1.085
+0.011
1.01%
1 jan 2007 ano
1.147
+0.062
5.72%
1 jan 2008 ano
1.166
+0.018
1.61%
1 jan 2009 ano
1.09
-0.076
-6.48%
1 jan 2010 ano
1.07
-0.02
-1.85%
1 jan 2011 ano
1.052
-0.018
-1.7%
1 jan 2012 ano
1.098
+0.046
4.38%
1 jan 2013 ano
1.185
+0.088
7.97%
1 jan 2014 ano
1.044
-0.141
-11.92%
Classificação de países por estatísticas atuais por anos


Comentários: