29
/pt/
pt
AIzaSyAYiBZKx7MnpbEhh9jyipgxe19OcubqV5w
April 1, 2024
224634
Poland
POL
true
2
1
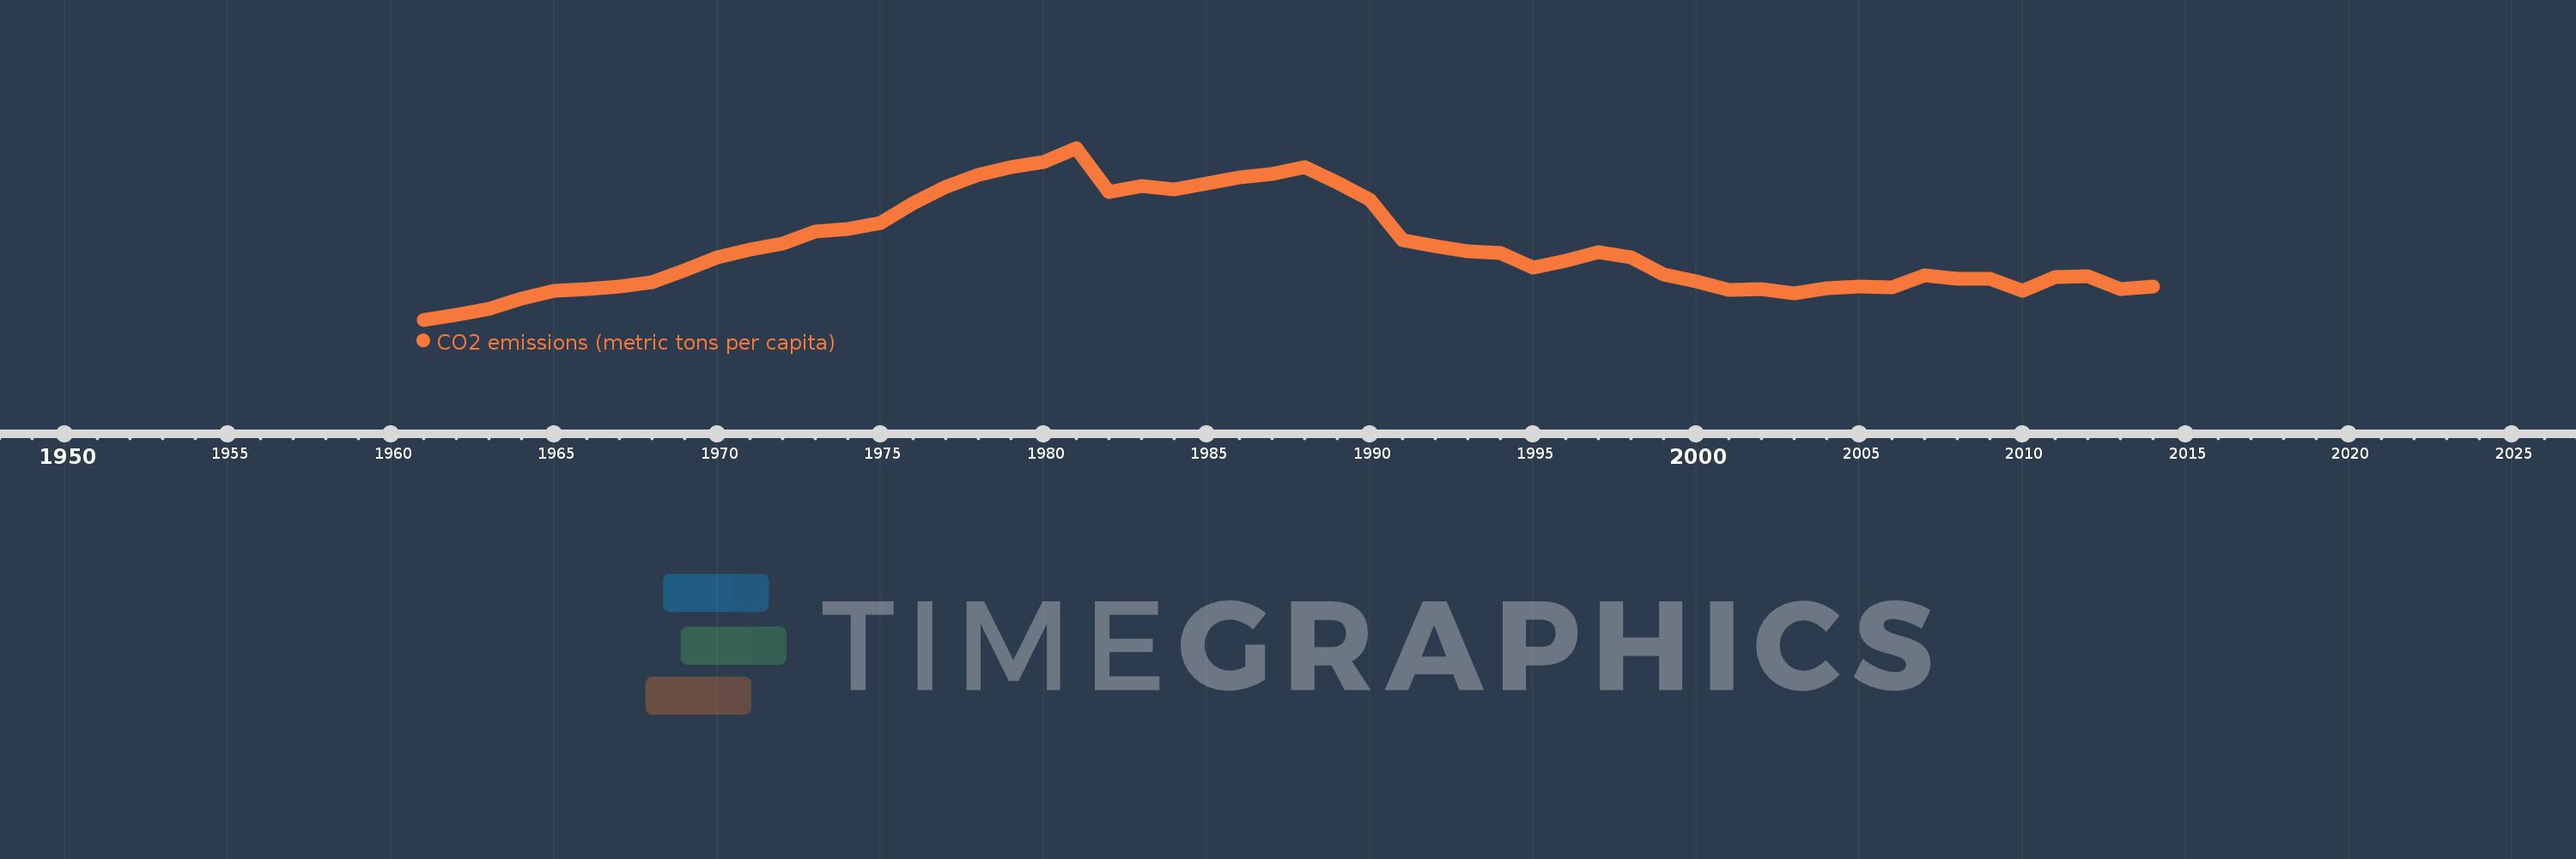
CO2 emissions (metric tons per capita)
2014,2013,2012,2011,2010,2009,2008,2007,2006,2005,2004,2003,2002,2001,2000,1999,1998,1997,1996,1995,1994,1993,1992,1991,1990,1989,1988,1987,1986,1985,1984,1983,1982,1981,1980,1979,1978,1977,1976,1975,1974,1973,1972,1971,1970,1969,1968,1967,1966,1965,1964,1963,1962,1961
Estas estatísticas em outros países:
AfghanistanAlbaniaAlgeriaAndorraAngolaAntigua and BarbudaArab WorldArgentinaArmeniaArubaAustraliaAustriaAzerbaijanBahamas, TheBahrainBangladeshBarbadosBelarusBelgiumBelizeBeninBermudaBhutanBoliviaBosnia and HerzegovinaBotswanaBrazilBritish Virgin IslandsBrunei DarussalamBulgariaBurkina FasoBurundiCabo VerdeCambodiaCameroonCanadaCaribbean small statesCayman IslandsCentral African RepublicCentral Europe and the BalticsChadChileChinaColombiaComorosCongo, Dem. Rep.Congo, Rep.Costa RicaCote d'IvoireCroatiaCubaCuracaoCyprusCzech RepublicDenmarkDjiboutiDominicaDominican RepublicEarly-demographic dividendEast Asia & PacificEast Asia & Pacific (excluding high income)East Asia & Pacific (IDA & IBRD countries)EcuadorEgypt, Arab Rep.El SalvadorEquatorial GuineaEritreaEstoniaEthiopiaEuro areaEurope & Central AsiaEurope & Central Asia (excluding high income)Europe & Central Asia (IDA & IBRD countries)European UnionFaroe IslandsFijiFinlandFragile and conflict affected situationsFranceFrench PolynesiaGabonGambia, TheGeorgiaGermanyGhanaGibraltarGreeceGreenlandGrenadaGuatemalaGuineaGuinea-BissauGuyanaHaitiHeavily indebted poor countries (HIPC)High incomeHondurasHong Kong SAR, ChinaHungaryIBRD onlyIcelandIDA & IBRD totalIDA blendIDA onlyIDA totalIndiaIndonesiaIran, Islamic Rep.IraqIrelandIsraelItalyJamaicaJapanJordanKazakhstanKenyaKiribatiKorea, Dem. People’s Rep.Korea, Rep.KuwaitKyrgyz RepublicLao PDRLate-demographic dividendLatin America & Caribbean Latin America & Caribbean (excluding high income)Latin America & the Caribbean (IDA & IBRD countries)LatviaLeast developed countries: UN classificationLebanonLesothoLiberiaLibyaLiechtensteinLithuaniaLow & middle incomeLow incomeLower middle incomeLuxembourgMacao SAR, ChinaMacedonia, FYRMadagascarMalawiMalaysiaMaldivesMaliMaltaMarshall IslandsMauritaniaMauritiusMexicoMicronesia, Fed. Sts.Middle East & North AfricaMiddle East & North Africa (excluding high income)Middle East & North Africa (IDA & IBRD countries)Middle incomeMoldovaMongoliaMontenegroMoroccoMozambiqueMyanmarNamibiaNauruNepalNetherlandsNew CaledoniaNew ZealandNicaraguaNigerNigeriaNorth AmericaNorwayOECD membersOmanOther small statesPacific island small statesPakistanPalauPanamaPapua New GuineaParaguayPeruPhilippinesPolandPortugalPost-demographic dividendPre-demographic dividendQatarRomaniaRussian FederationRwandaSamoaSao Tome and PrincipeSaudi ArabiaSenegalSerbiaSeychellesSierra LeoneSingaporeSint Maarten (Dutch part)Slovak RepublicSloveniaSmall statesSolomon IslandsSomaliaSouth AfricaSouth AsiaSouth Asia (IDA & IBRD)South SudanSpainSri LankaSt. Kitts and NevisSt. LuciaSt. Vincent and the GrenadinesSub-Saharan Africa Sub-Saharan Africa (excluding high income)Sub-Saharan Africa (IDA & IBRD countries)SudanSurinameSwazilandSwedenSwitzerlandSyrian Arab RepublicTajikistanTanzaniaThailandTimor-LesteTogoTongaTrinidad and TobagoTunisiaTurkeyTurkmenistanTurks and Caicos IslandsUgandaUkraineUnited Arab EmiratesUnited KingdomUnited StatesUpper middle incomeUruguayUzbekistanVanuatuVenezuela, RBVietnamWest Bank and GazaWorldYemen, Rep.ZambiaZimbabwe Linha do tempo:
Nesta escala de tempo está apresentado um gráfico de 1961 ano até 2014 ano Poland. Dados de 1960 ano ausente. O número de observações reais por data: 54.
Fonte (nome):
Indicadores de desenvolvimento mundial
Fonte (organização):
Carbon Dioxide Information Analysis Center, Environmental Sciences Division, Oak Ridge National Laboratory, Tennessee, United States.
Categorias:
Climate Change, Environment
Foi atualizado:
23 abr 2017 ano
Indicadores de alterações dos valores ao longo dos anos
Mínimo:
6.74
1 jan 1961 ano
Máximo:
13.059
1 jan 1981 ano
Na data de observação
Valor
Mudança absoluta
A alteração em relação ao valor anterior
1 jan 1961 ano
6.74
+6.74
0.0%
1 jan 1962 ano
6.923
+0.182
2.71%
1 jan 1963 ano
7.154
+0.231
3.33%
1 jan 1964 ano
7.529
+0.375
5.24%
1 jan 1965 ano
7.807
+0.279
3.7%
1 jan 1966 ano
7.862
+0.055
0.7%
1 jan 1967 ano
7.976
+0.114
1.45%
1 jan 1968 ano
8.106
+0.13
1.63%
1 jan 1969 ano
8.549
+0.443
5.46%
1 jan 1970 ano
9.022
+0.473
5.54%
1 jan 1971 ano
9.32
+0.298
3.31%
1 jan 1972 ano
9.555
+0.235
2.52%
1 jan 1973 ano
9.982
+0.427
4.47%
1 jan 1974 ano
10.077
+0.095
0.95%
1 jan 1975 ano
10.3
+0.223
2.21%
1 jan 1976 ano
11.041
+0.741
7.2%
1 jan 1977 ano
11.615
+0.574
5.2%
1 jan 1978 ano
12.079
+0.465
4.0%
1 jan 1979 ano
12.357
+0.277
2.29%
1 jan 1980 ano
12.554
+0.197
1.6%
1 jan 1981 ano
13.059
+0.505
4.03%
1 jan 1982 ano
11.423
-1.637
-12.53%
1 jan 1983 ano
11.653
+0.231
2.02%
1 jan 1984 ano
11.548
-0.105
-0.9%
1 jan 1985 ano
11.757
+0.209
1.81%
1 jan 1986 ano
11.986
+0.229
1.94%
1 jan 1987 ano
12.104
+0.118
0.99%
1 jan 1988 ano
12.354
+0.25
2.07%
1 jan 1989 ano
11.791
-0.563
-4.56%
1 jan 1990 ano
11.164
-0.627
-5.32%
1 jan 1991 ano
9.667
-1.496
-13.4%
1 jan 1992 ano
9.456
-0.212
-2.19%
1 jan 1993 ano
9.247
-0.209
-2.21%
1 jan 1994 ano
9.185
-0.062
-0.67%
1 jan 1995 ano
8.665
-0.52
-5.66%
1 jan 1996 ano
8.919
+0.254
2.93%
1 jan 1997 ano
9.211
+0.292
3.27%
1 jan 1998 ano
9.043
-0.167
-1.82%
1 jan 1999 ano
8.417
-0.626
-6.93%
1 jan 2000 ano
8.167
-0.25
-2.98%
1 jan 2001 ano
7.823
-0.344
-4.21%
1 jan 2002 ano
7.877
+0.054
0.69%
1 jan 2003 ano
7.712
-0.165
-2.1%
1 jan 2004 ano
7.911
+0.199
2.59%
1 jan 2005 ano
7.973
+0.061
0.77%
1 jan 2006 ano
7.927
-0.046
-0.57%
1 jan 2007 ano
8.362
+0.435
5.49%
1 jan 2008 ano
8.244
-0.118
-1.41%
1 jan 2009 ano
8.258
+0.014
0.17%
1 jan 2010 ano
7.801
-0.457
-5.54%
1 jan 2011 ano
8.313
+0.512
6.57%
1 jan 2012 ano
8.328
+0.015
0.18%
1 jan 2013 ano
7.881
-0.448
-5.37%
1 jan 2014 ano
7.948
+0.067
0.85%
Classificação de países por estatísticas atuais por anos


Comentários: