29
/pt/
pt
AIzaSyAYiBZKx7MnpbEhh9jyipgxe19OcubqV5w
April 1, 2024
218075
Panama
PAN
true
2
1
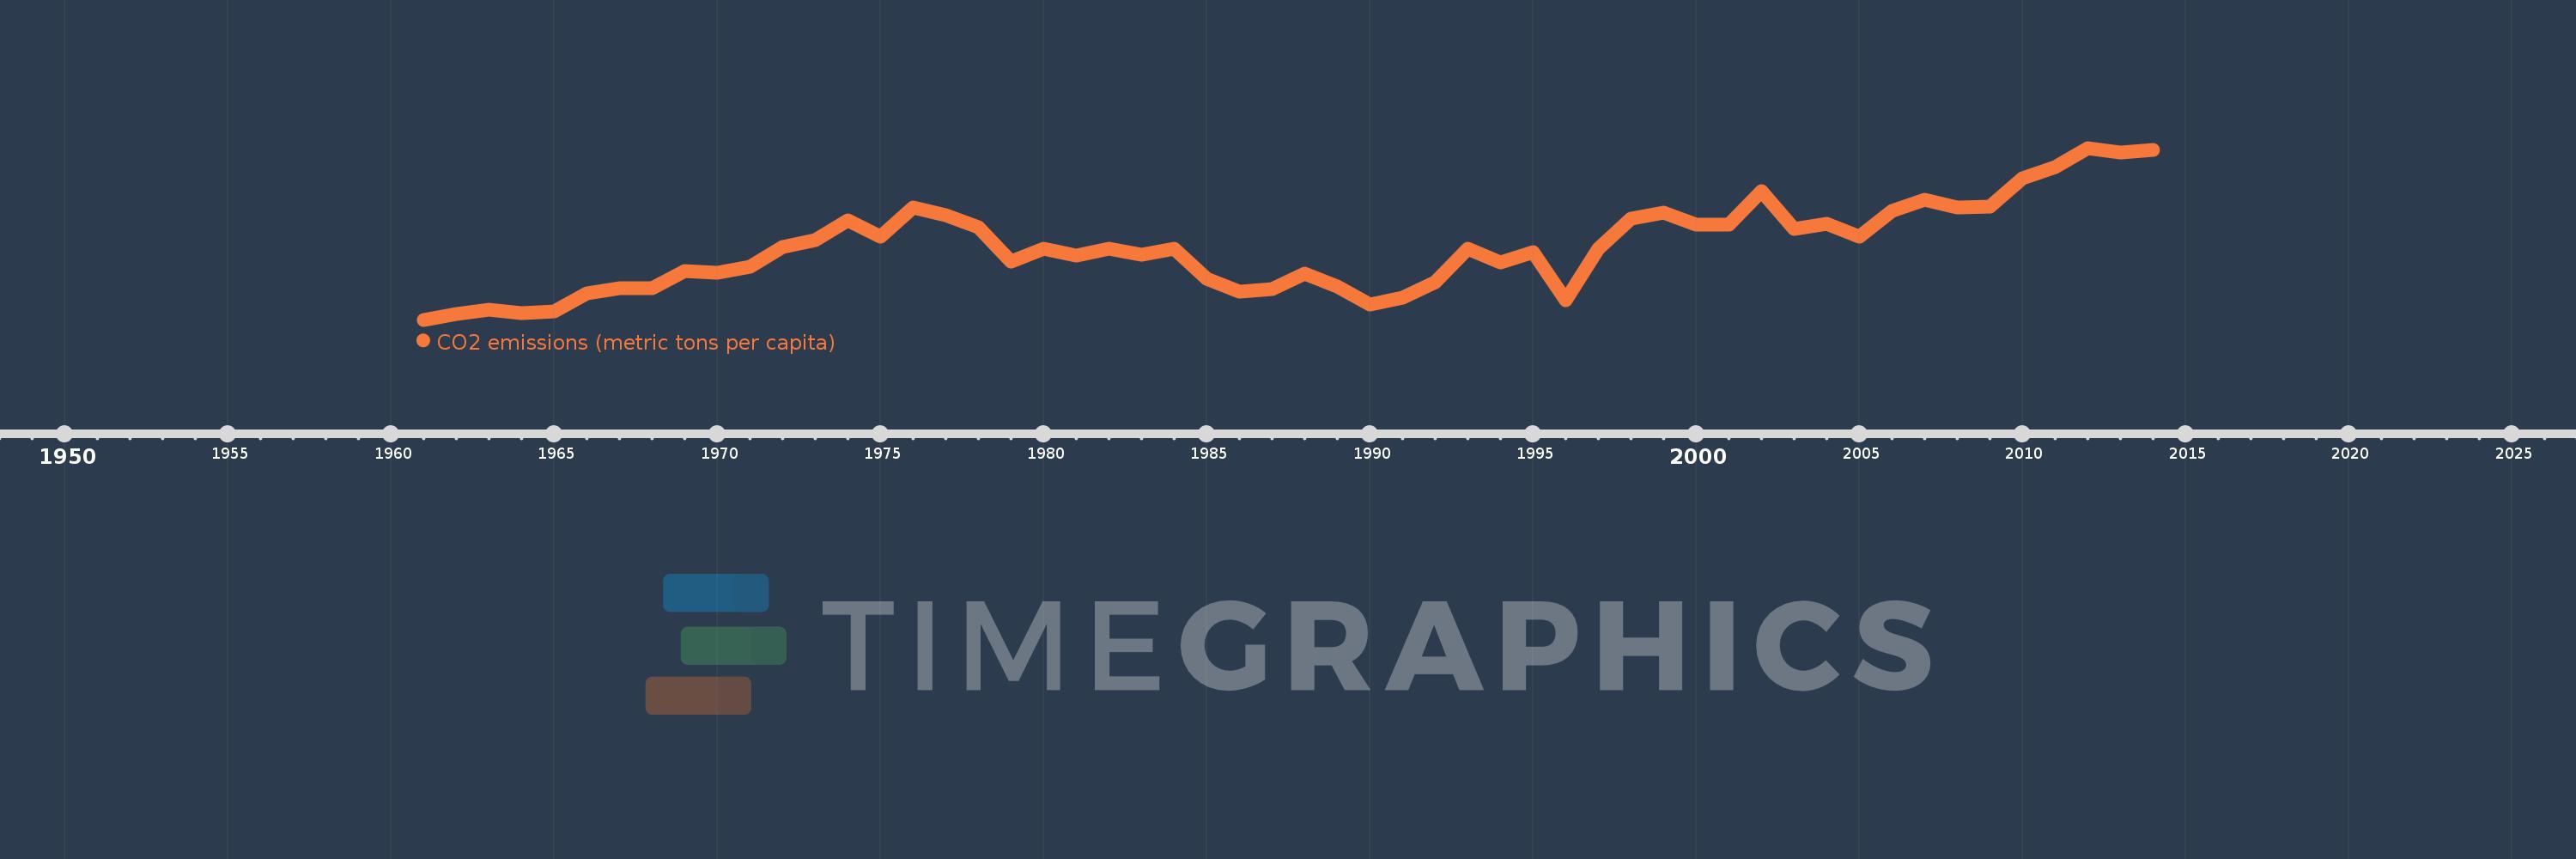
CO2 emissions (metric tons per capita)
2014,2013,2012,2011,2010,2009,2008,2007,2006,2005,2004,2003,2002,2001,2000,1999,1998,1997,1996,1995,1994,1993,1992,1991,1990,1989,1988,1987,1986,1985,1984,1983,1982,1981,1980,1979,1978,1977,1976,1975,1974,1973,1972,1971,1970,1969,1968,1967,1966,1965,1964,1963,1962,1961
Estas estatísticas em outros países:
AfghanistanAlbaniaAlgeriaAndorraAngolaAntigua and BarbudaArab WorldArgentinaArmeniaArubaAustraliaAustriaAzerbaijanBahamas, TheBahrainBangladeshBarbadosBelarusBelgiumBelizeBeninBermudaBhutanBoliviaBosnia and HerzegovinaBotswanaBrazilBritish Virgin IslandsBrunei DarussalamBulgariaBurkina FasoBurundiCabo VerdeCambodiaCameroonCanadaCaribbean small statesCayman IslandsCentral African RepublicCentral Europe and the BalticsChadChileChinaColombiaComorosCongo, Dem. Rep.Congo, Rep.Costa RicaCote d'IvoireCroatiaCubaCuracaoCyprusCzech RepublicDenmarkDjiboutiDominicaDominican RepublicEarly-demographic dividendEast Asia & PacificEast Asia & Pacific (excluding high income)East Asia & Pacific (IDA & IBRD countries)EcuadorEgypt, Arab Rep.El SalvadorEquatorial GuineaEritreaEstoniaEthiopiaEuro areaEurope & Central AsiaEurope & Central Asia (excluding high income)Europe & Central Asia (IDA & IBRD countries)European UnionFaroe IslandsFijiFinlandFragile and conflict affected situationsFranceFrench PolynesiaGabonGambia, TheGeorgiaGermanyGhanaGibraltarGreeceGreenlandGrenadaGuatemalaGuineaGuinea-BissauGuyanaHaitiHeavily indebted poor countries (HIPC)High incomeHondurasHong Kong SAR, ChinaHungaryIBRD onlyIcelandIDA & IBRD totalIDA blendIDA onlyIDA totalIndiaIndonesiaIran, Islamic Rep.IraqIrelandIsraelItalyJamaicaJapanJordanKazakhstanKenyaKiribatiKorea, Dem. People’s Rep.Korea, Rep.KuwaitKyrgyz RepublicLao PDRLate-demographic dividendLatin America & Caribbean Latin America & Caribbean (excluding high income)Latin America & the Caribbean (IDA & IBRD countries)LatviaLeast developed countries: UN classificationLebanonLesothoLiberiaLibyaLiechtensteinLithuaniaLow & middle incomeLow incomeLower middle incomeLuxembourgMacao SAR, ChinaMacedonia, FYRMadagascarMalawiMalaysiaMaldivesMaliMaltaMarshall IslandsMauritaniaMauritiusMexicoMicronesia, Fed. Sts.Middle East & North AfricaMiddle East & North Africa (excluding high income)Middle East & North Africa (IDA & IBRD countries)Middle incomeMoldovaMongoliaMontenegroMoroccoMozambiqueMyanmarNamibiaNauruNepalNetherlandsNew CaledoniaNew ZealandNicaraguaNigerNigeriaNorth AmericaNorwayOECD membersOmanOther small statesPacific island small statesPakistanPalauPanamaPapua New GuineaParaguayPeruPhilippinesPolandPortugalPost-demographic dividendPre-demographic dividendQatarRomaniaRussian FederationRwandaSamoaSao Tome and PrincipeSaudi ArabiaSenegalSerbiaSeychellesSierra LeoneSingaporeSint Maarten (Dutch part)Slovak RepublicSloveniaSmall statesSolomon IslandsSomaliaSouth AfricaSouth AsiaSouth Asia (IDA & IBRD)South SudanSpainSri LankaSt. Kitts and NevisSt. LuciaSt. Vincent and the GrenadinesSub-Saharan Africa Sub-Saharan Africa (excluding high income)Sub-Saharan Africa (IDA & IBRD countries)SudanSurinameSwazilandSwedenSwitzerlandSyrian Arab RepublicTajikistanTanzaniaThailandTimor-LesteTogoTongaTrinidad and TobagoTunisiaTurkeyTurkmenistanTurks and Caicos IslandsUgandaUkraineUnited Arab EmiratesUnited KingdomUnited StatesUpper middle incomeUruguayUzbekistanVanuatuVenezuela, RBVietnamWest Bank and GazaWorldYemen, Rep.ZambiaZimbabwe Linha do tempo:
Nesta escala de tempo está apresentado um gráfico de 1961 ano até 2014 ano Panama. Dados de 1960 ano ausente. O número de observações reais por data: 54.
Fonte (nome):
Indicadores de desenvolvimento mundial
Fonte (organização):
Carbon Dioxide Information Analysis Center, Environmental Sciences Division, Oak Ridge National Laboratory, Tennessee, United States.
Categorias:
Climate Change, Environment
Foi atualizado:
23 abr 2017 ano
Indicadores de alterações dos valores ao longo dos anos
Mínimo:
0.88
1 jan 1961 ano
Máximo:
2.743
1 jan 2012 ano
Na data de observação
Valor
Mudança absoluta
A alteração em relação ao valor anterior
1 jan 1961 ano
0.88
+0.88
0.0%
1 jan 1962 ano
0.946
+0.065
7.43%
1 jan 1963 ano
0.991
+0.045
4.8%
1 jan 1964 ano
0.956
-0.035
-3.54%
1 jan 1965 ano
0.974
+0.018
1.87%
1 jan 1966 ano
1.163
+0.189
19.42%
1 jan 1967 ano
1.224
+0.061
5.26%
1 jan 1968 ano
1.218
-0.006
-0.51%
1 jan 1969 ano
1.408
+0.19
15.62%
1 jan 1970 ano
1.391
-0.018
-1.25%
1 jan 1971 ano
1.451
+0.06
4.3%
1 jan 1972 ano
1.666
+0.215
14.82%
1 jan 1973 ano
1.742
+0.077
4.61%
1 jan 1974 ano
1.961
+0.218
12.53%
1 jan 1975 ano
1.778
-0.182
-9.3%
1 jan 1976 ano
2.099
+0.321
18.04%
1 jan 1977 ano
2.016
-0.083
-3.95%
1 jan 1978 ano
1.883
-0.133
-6.58%
1 jan 1979 ano
1.508
-0.375
-19.93%
1 jan 1980 ano
1.654
+0.146
9.66%
1 jan 1981 ano
1.579
-0.075
-4.51%
1 jan 1982 ano
1.649
+0.07
4.42%
1 jan 1983 ano
1.588
-0.061
-3.7%
1 jan 1984 ano
1.647
+0.059
3.72%
1 jan 1985 ano
1.328
-0.319
-19.37%
1 jan 1986 ano
1.185
-0.143
-10.79%
1 jan 1987 ano
1.214
+0.029
2.46%
1 jan 1988 ano
1.381
+0.167
13.75%
1 jan 1989 ano
1.237
-0.144
-10.42%
1 jan 1990 ano
1.043
-0.194
-15.7%
1 jan 1991 ano
1.12
+0.078
7.46%
1 jan 1992 ano
1.286
+0.166
14.81%
1 jan 1993 ano
1.649
+0.363
28.18%
1 jan 1994 ano
1.5
-0.149
-9.05%
1 jan 1995 ano
1.617
+0.117
7.82%
1 jan 1996 ano
1.09
-0.527
-32.58%
1 jan 1997 ano
1.655
+0.564
51.77%
1 jan 1998 ano
1.98
+0.325
19.65%
1 jan 1999 ano
2.043
+0.063
3.2%
1 jan 2000 ano
1.909
-0.134
-6.57%
1 jan 2001 ano
1.912
+0.003
0.16%
1 jan 2002 ano
2.27
+0.358
18.75%
1 jan 2003 ano
1.867
-0.403
-17.76%
1 jan 2004 ano
1.921
+0.054
2.92%
1 jan 2005 ano
1.78
-0.141
-7.34%
1 jan 2006 ano
2.06
+0.28
15.73%
1 jan 2007 ano
2.182
+0.121
5.88%
1 jan 2008 ano
2.094
-0.088
-4.04%
1 jan 2009 ano
2.108
+0.014
0.68%
1 jan 2010 ano
2.416
+0.308
14.62%
1 jan 2011 ano
2.531
+0.115
4.77%
1 jan 2012 ano
2.743
+0.212
8.36%
1 jan 2013 ano
2.694
-0.049
-1.79%
1 jan 2014 ano
2.723
+0.029
1.09%
Classificação de países por estatísticas atuais por anos


Comentários: