29
/pt/
pt
AIzaSyAYiBZKx7MnpbEhh9jyipgxe19OcubqV5w
April 1, 2024
162308
Jamaica
JAM
true
2
1
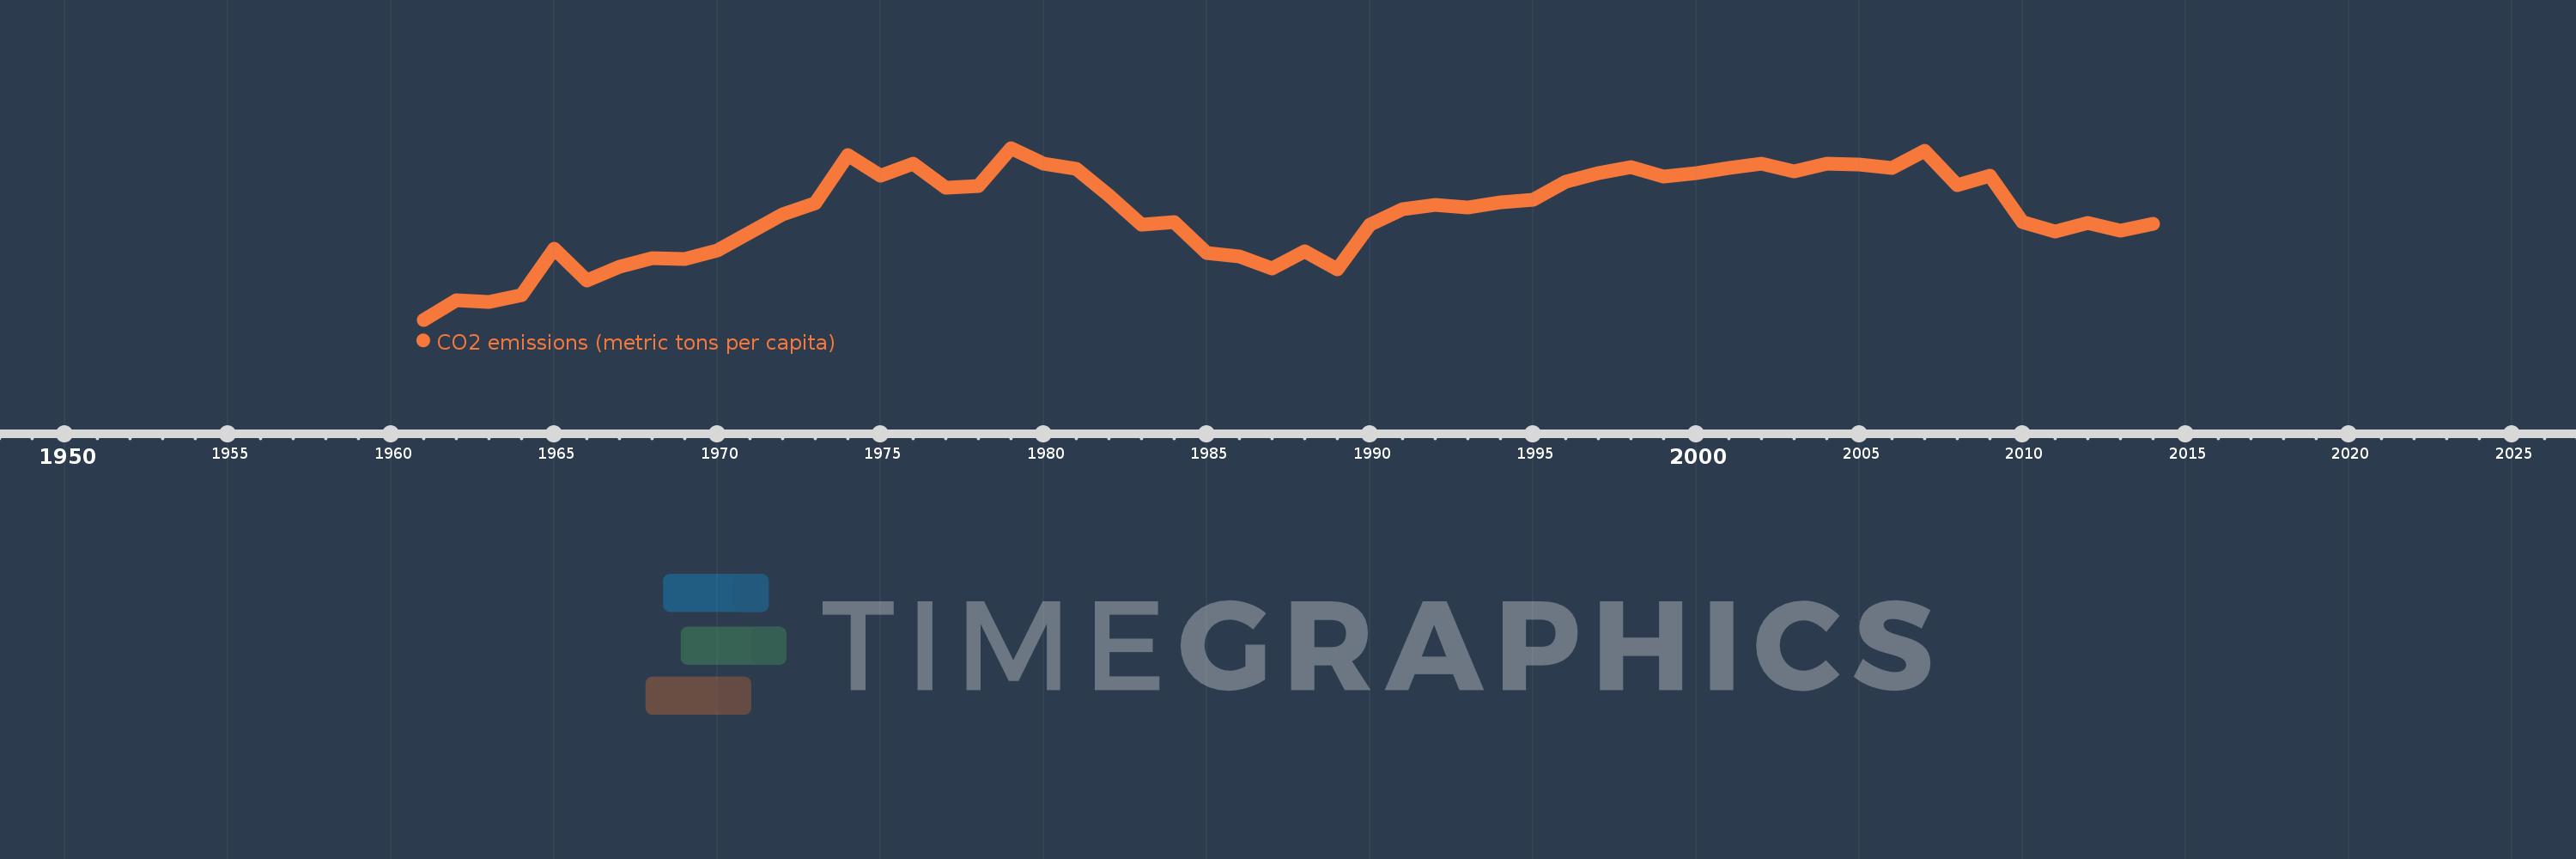
CO2 emissions (metric tons per capita)
2014,2013,2012,2011,2010,2009,2008,2007,2006,2005,2004,2003,2002,2001,2000,1999,1998,1997,1996,1995,1994,1993,1992,1991,1990,1989,1988,1987,1986,1985,1984,1983,1982,1981,1980,1979,1978,1977,1976,1975,1974,1973,1972,1971,1970,1969,1968,1967,1966,1965,1964,1963,1962,1961
Estas estatísticas em outros países:
AfghanistanAlbaniaAlgeriaAndorraAngolaAntigua and BarbudaArab WorldArgentinaArmeniaArubaAustraliaAustriaAzerbaijanBahamas, TheBahrainBangladeshBarbadosBelarusBelgiumBelizeBeninBermudaBhutanBoliviaBosnia and HerzegovinaBotswanaBrazilBritish Virgin IslandsBrunei DarussalamBulgariaBurkina FasoBurundiCabo VerdeCambodiaCameroonCanadaCaribbean small statesCayman IslandsCentral African RepublicCentral Europe and the BalticsChadChileChinaColombiaComorosCongo, Dem. Rep.Congo, Rep.Costa RicaCote d'IvoireCroatiaCubaCuracaoCyprusCzech RepublicDenmarkDjiboutiDominicaDominican RepublicEarly-demographic dividendEast Asia & PacificEast Asia & Pacific (excluding high income)East Asia & Pacific (IDA & IBRD countries)EcuadorEgypt, Arab Rep.El SalvadorEquatorial GuineaEritreaEstoniaEthiopiaEuro areaEurope & Central AsiaEurope & Central Asia (excluding high income)Europe & Central Asia (IDA & IBRD countries)European UnionFaroe IslandsFijiFinlandFragile and conflict affected situationsFranceFrench PolynesiaGabonGambia, TheGeorgiaGermanyGhanaGibraltarGreeceGreenlandGrenadaGuatemalaGuineaGuinea-BissauGuyanaHaitiHeavily indebted poor countries (HIPC)High incomeHondurasHong Kong SAR, ChinaHungaryIBRD onlyIcelandIDA & IBRD totalIDA blendIDA onlyIDA totalIndiaIndonesiaIran, Islamic Rep.IraqIrelandIsraelItalyJamaicaJapanJordanKazakhstanKenyaKiribatiKorea, Dem. People’s Rep.Korea, Rep.KuwaitKyrgyz RepublicLao PDRLate-demographic dividendLatin America & Caribbean Latin America & Caribbean (excluding high income)Latin America & the Caribbean (IDA & IBRD countries)LatviaLeast developed countries: UN classificationLebanonLesothoLiberiaLibyaLiechtensteinLithuaniaLow & middle incomeLow incomeLower middle incomeLuxembourgMacao SAR, ChinaMacedonia, FYRMadagascarMalawiMalaysiaMaldivesMaliMaltaMarshall IslandsMauritaniaMauritiusMexicoMicronesia, Fed. Sts.Middle East & North AfricaMiddle East & North Africa (excluding high income)Middle East & North Africa (IDA & IBRD countries)Middle incomeMoldovaMongoliaMontenegroMoroccoMozambiqueMyanmarNamibiaNauruNepalNetherlandsNew CaledoniaNew ZealandNicaraguaNigerNigeriaNorth AmericaNorwayOECD membersOmanOther small statesPacific island small statesPakistanPalauPanamaPapua New GuineaParaguayPeruPhilippinesPolandPortugalPost-demographic dividendPre-demographic dividendQatarRomaniaRussian FederationRwandaSamoaSao Tome and PrincipeSaudi ArabiaSenegalSerbiaSeychellesSierra LeoneSingaporeSint Maarten (Dutch part)Slovak RepublicSloveniaSmall statesSolomon IslandsSomaliaSouth AfricaSouth AsiaSouth Asia (IDA & IBRD)South SudanSpainSri LankaSt. Kitts and NevisSt. LuciaSt. Vincent and the GrenadinesSub-Saharan Africa Sub-Saharan Africa (excluding high income)Sub-Saharan Africa (IDA & IBRD countries)SudanSurinameSwazilandSwedenSwitzerlandSyrian Arab RepublicTajikistanTanzaniaThailandTimor-LesteTogoTongaTrinidad and TobagoTunisiaTurkeyTurkmenistanTurks and Caicos IslandsUgandaUkraineUnited Arab EmiratesUnited KingdomUnited StatesUpper middle incomeUruguayUzbekistanVanuatuVenezuela, RBVietnamWest Bank and GazaWorldYemen, Rep.ZambiaZimbabwe Linha do tempo:
Nesta escala de tempo está apresentado um gráfico de 1961 ano até 2014 ano Jamaica. Dados de 1960 ano ausente. O número de observações reais por data: 54.
Fonte (nome):
Indicadores de desenvolvimento mundial
Fonte (organização):
Carbon Dioxide Information Analysis Center, Environmental Sciences Division, Oak Ridge National Laboratory, Tennessee, United States.
Categorias:
Climate Change, Environment
Foi atualizado:
23 abr 2017 ano
Indicadores de alterações dos valores ao longo dos anos
Mínimo:
0.903
1 jan 1961 ano
Máximo:
4.384
1 jan 1979 ano
Na data de observação
Valor
Mudança absoluta
A alteração em relação ao valor anterior
1 jan 1961 ano
0.903
+0.903
0.0%
1 jan 1962 ano
1.29
+0.387
42.88%
1 jan 1963 ano
1.263
-0.027
-2.09%
1 jan 1964 ano
1.405
+0.142
11.26%
1 jan 1965 ano
2.344
+0.939
66.86%
1 jan 1966 ano
1.7
-0.644
-27.48%
1 jan 1967 ano
1.974
+0.274
16.12%
1 jan 1968 ano
2.145
+0.17
8.63%
1 jan 1969 ano
2.129
-0.015
-0.71%
1 jan 1970 ano
2.316
+0.186
8.74%
1 jan 1971 ano
2.672
+0.357
15.4%
1 jan 1972 ano
3.035
+0.363
13.58%
1 jan 1973 ano
3.267
+0.232
7.63%
1 jan 1974 ano
4.242
+0.976
29.87%
1 jan 1975 ano
3.828
-0.414
-9.77%
1 jan 1976 ano
4.068
+0.24
6.27%
1 jan 1977 ano
3.574
-0.494
-12.14%
1 jan 1978 ano
3.616
+0.042
1.19%
1 jan 1979 ano
4.384
+0.767
21.22%
1 jan 1980 ano
4.057
-0.327
-7.45%
1 jan 1981 ano
3.963
-0.094
-2.33%
1 jan 1982 ano
3.429
-0.534
-13.47%
1 jan 1983 ano
2.827
-0.602
-17.56%
1 jan 1984 ano
2.879
+0.052
1.83%
1 jan 1985 ano
2.257
-0.622
-21.61%
1 jan 1986 ano
2.183
-0.073
-3.25%
1 jan 1987 ano
1.948
-0.235
-10.76%
1 jan 1988 ano
2.29
+0.342
17.55%
1 jan 1989 ano
1.922
-0.368
-16.08%
1 jan 1990 ano
2.833
+0.911
47.43%
1 jan 1991 ano
3.151
+0.318
11.23%
1 jan 1992 ano
3.223
+0.072
2.28%
1 jan 1993 ano
3.184
-0.039
-1.22%
1 jan 1994 ano
3.279
+0.095
2.99%
1 jan 1995 ano
3.332
+0.052
1.59%
1 jan 1996 ano
3.701
+0.369
11.09%
1 jan 1997 ano
3.866
+0.165
4.45%
1 jan 1998 ano
3.998
+0.132
3.43%
1 jan 1999 ano
3.801
-0.198
-4.94%
1 jan 2000 ano
3.876
+0.075
1.98%
1 jan 2001 ano
3.981
+0.105
2.71%
1 jan 2002 ano
4.074
+0.094
2.35%
1 jan 2003 ano
3.916
-0.158
-3.88%
1 jan 2004 ano
4.064
+0.148
3.78%
1 jan 2005 ano
4.051
-0.013
-0.32%
1 jan 2006 ano
3.971
-0.08
-1.97%
1 jan 2007 ano
4.333
+0.362
9.11%
1 jan 2008 ano
3.625
-0.708
-16.34%
1 jan 2009 ano
3.821
+0.196
5.4%
1 jan 2010 ano
2.887
-0.934
-24.44%
1 jan 2011 ano
2.697
-0.19
-6.58%
1 jan 2012 ano
2.86
+0.163
6.06%
1 jan 2013 ano
2.706
-0.155
-5.41%
1 jan 2014 ano
2.846
+0.14
5.19%
Classificação de países por estatísticas atuais por anos


Comentários: