29
/pt/
pt
AIzaSyAYiBZKx7MnpbEhh9jyipgxe19OcubqV5w
April 1, 2024
135303
Gabon
GAB
true
2
1
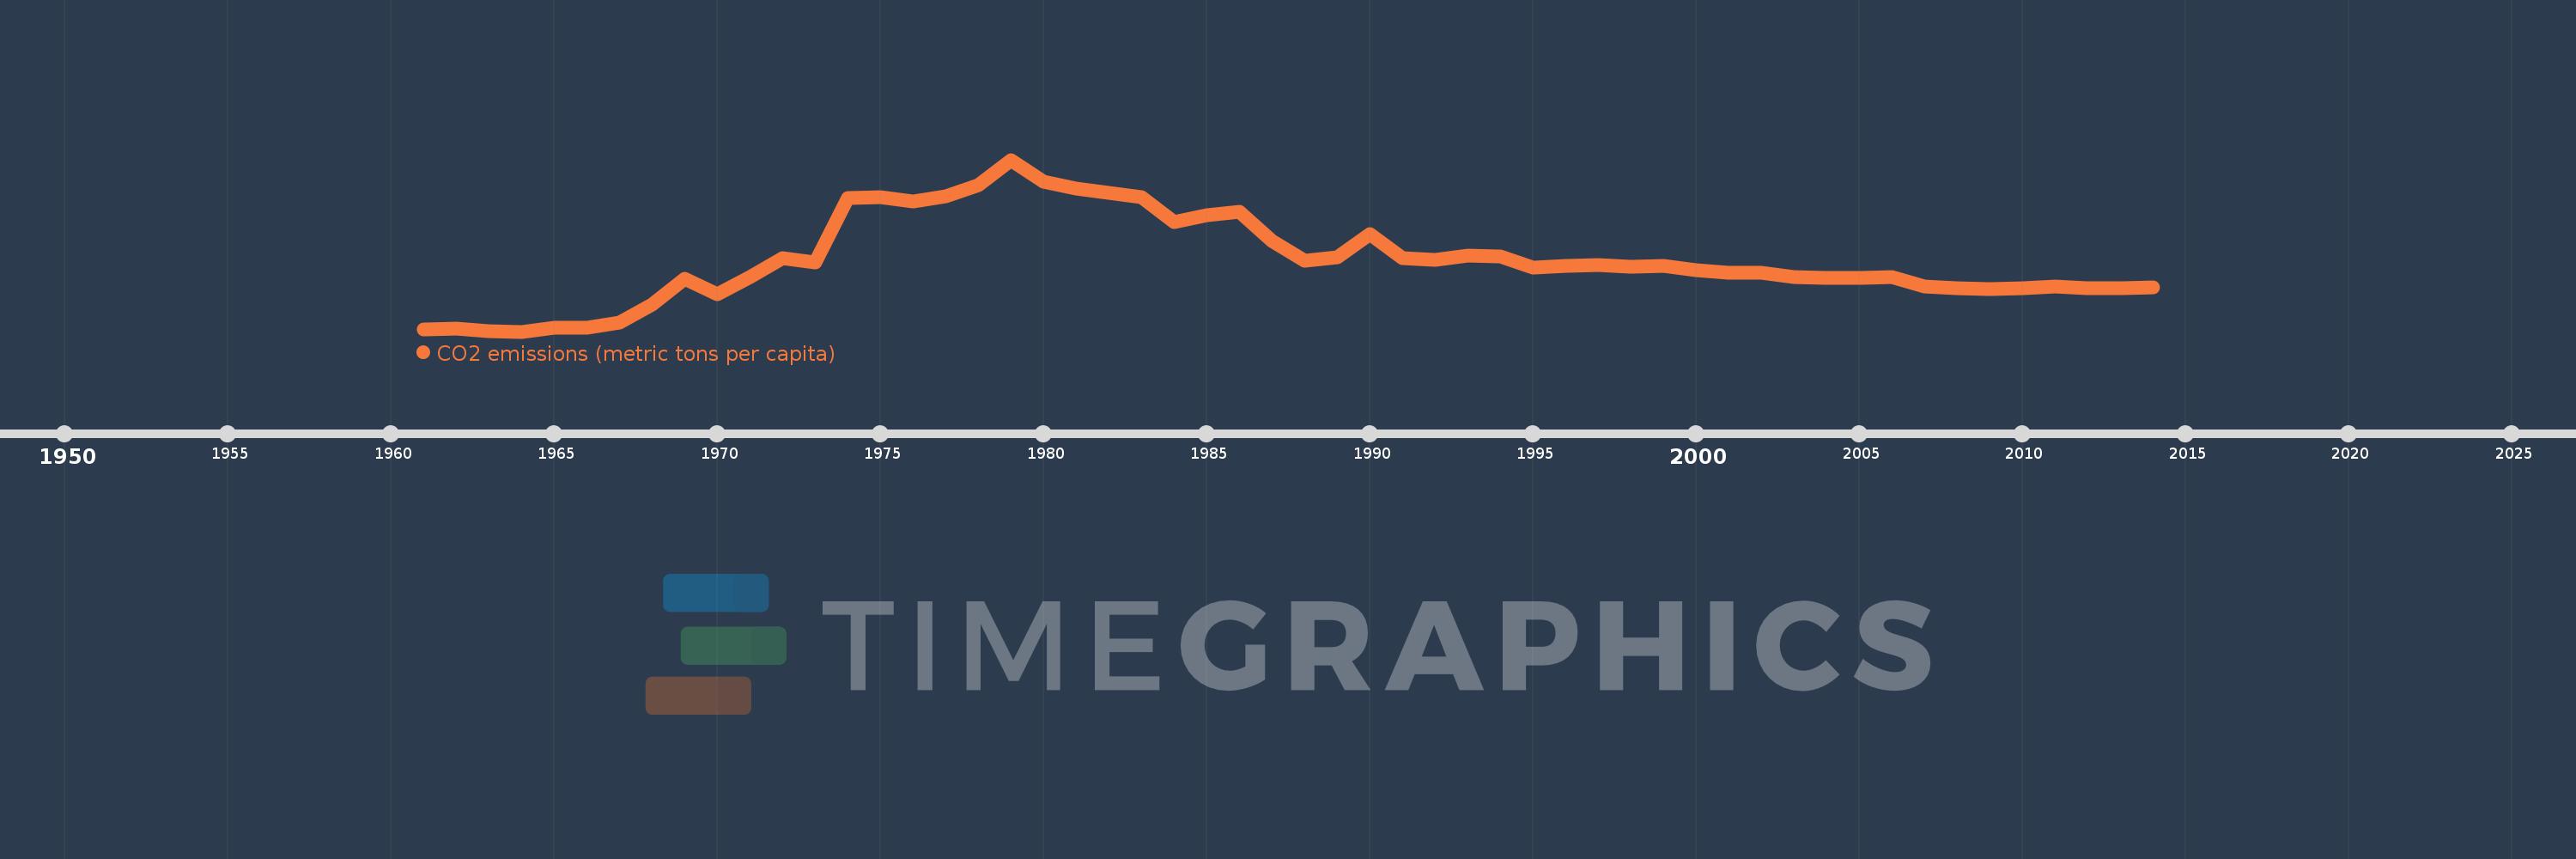
CO2 emissions (metric tons per capita)
2014,2013,2012,2011,2010,2009,2008,2007,2006,2005,2004,2003,2002,2001,2000,1999,1998,1997,1996,1995,1994,1993,1992,1991,1990,1989,1988,1987,1986,1985,1984,1983,1982,1981,1980,1979,1978,1977,1976,1975,1974,1973,1972,1971,1970,1969,1968,1967,1966,1965,1964,1963,1962,1961
Estas estatísticas em outros países:
AfghanistanAlbaniaAlgeriaAndorraAngolaAntigua and BarbudaArab WorldArgentinaArmeniaArubaAustraliaAustriaAzerbaijanBahamas, TheBahrainBangladeshBarbadosBelarusBelgiumBelizeBeninBermudaBhutanBoliviaBosnia and HerzegovinaBotswanaBrazilBritish Virgin IslandsBrunei DarussalamBulgariaBurkina FasoBurundiCabo VerdeCambodiaCameroonCanadaCaribbean small statesCayman IslandsCentral African RepublicCentral Europe and the BalticsChadChileChinaColombiaComorosCongo, Dem. Rep.Congo, Rep.Costa RicaCote d'IvoireCroatiaCubaCuracaoCyprusCzech RepublicDenmarkDjiboutiDominicaDominican RepublicEarly-demographic dividendEast Asia & PacificEast Asia & Pacific (excluding high income)East Asia & Pacific (IDA & IBRD countries)EcuadorEgypt, Arab Rep.El SalvadorEquatorial GuineaEritreaEstoniaEthiopiaEuro areaEurope & Central AsiaEurope & Central Asia (excluding high income)Europe & Central Asia (IDA & IBRD countries)European UnionFaroe IslandsFijiFinlandFragile and conflict affected situationsFranceFrench PolynesiaGabonGambia, TheGeorgiaGermanyGhanaGibraltarGreeceGreenlandGrenadaGuatemalaGuineaGuinea-BissauGuyanaHaitiHeavily indebted poor countries (HIPC)High incomeHondurasHong Kong SAR, ChinaHungaryIBRD onlyIcelandIDA & IBRD totalIDA blendIDA onlyIDA totalIndiaIndonesiaIran, Islamic Rep.IraqIrelandIsraelItalyJamaicaJapanJordanKazakhstanKenyaKiribatiKorea, Dem. People’s Rep.Korea, Rep.KuwaitKyrgyz RepublicLao PDRLate-demographic dividendLatin America & Caribbean Latin America & Caribbean (excluding high income)Latin America & the Caribbean (IDA & IBRD countries)LatviaLeast developed countries: UN classificationLebanonLesothoLiberiaLibyaLiechtensteinLithuaniaLow & middle incomeLow incomeLower middle incomeLuxembourgMacao SAR, ChinaMacedonia, FYRMadagascarMalawiMalaysiaMaldivesMaliMaltaMarshall IslandsMauritaniaMauritiusMexicoMicronesia, Fed. Sts.Middle East & North AfricaMiddle East & North Africa (excluding high income)Middle East & North Africa (IDA & IBRD countries)Middle incomeMoldovaMongoliaMontenegroMoroccoMozambiqueMyanmarNamibiaNauruNepalNetherlandsNew CaledoniaNew ZealandNicaraguaNigerNigeriaNorth AmericaNorwayOECD membersOmanOther small statesPacific island small statesPakistanPalauPanamaPapua New GuineaParaguayPeruPhilippinesPolandPortugalPost-demographic dividendPre-demographic dividendQatarRomaniaRussian FederationRwandaSamoaSao Tome and PrincipeSaudi ArabiaSenegalSerbiaSeychellesSierra LeoneSingaporeSint Maarten (Dutch part)Slovak RepublicSloveniaSmall statesSolomon IslandsSomaliaSouth AfricaSouth AsiaSouth Asia (IDA & IBRD)South SudanSpainSri LankaSt. Kitts and NevisSt. LuciaSt. Vincent and the GrenadinesSub-Saharan Africa Sub-Saharan Africa (excluding high income)Sub-Saharan Africa (IDA & IBRD countries)SudanSurinameSwazilandSwedenSwitzerlandSyrian Arab RepublicTajikistanTanzaniaThailandTimor-LesteTogoTongaTrinidad and TobagoTunisiaTurkeyTurkmenistanTurks and Caicos IslandsUgandaUkraineUnited Arab EmiratesUnited KingdomUnited StatesUpper middle incomeUruguayUzbekistanVanuatuVenezuela, RBVietnamWest Bank and GazaWorldYemen, Rep.ZambiaZimbabwe Linha do tempo:
Nesta escala de tempo está apresentado um gráfico de 1961 ano até 2014 ano Gabon. Dados de 1960 ano ausente. O número de observações reais por data: 54.
Fonte (nome):
Indicadores de desenvolvimento mundial
Fonte (organização):
Carbon Dioxide Information Analysis Center, Environmental Sciences Division, Oak Ridge National Laboratory, Tennessee, United States.
Categorias:
Climate Change, Environment
Foi atualizado:
23 abr 2017 ano
Indicadores de alterações dos valores ao longo dos anos
Mínimo:
0.142
1 jan 1964 ano
Máximo:
10.884
1 jan 1979 ano
Na data de observação
Valor
Mudança absoluta
A alteração em relação ao valor anterior
1 jan 1961 ano
0.264
+0.264
0.0%
1 jan 1962 ano
0.327
+0.063
23.76%
1 jan 1963 ano
0.173
-0.155
-47.26%
1 jan 1964 ano
0.142
-0.031
-17.71%
1 jan 1965 ano
0.364
+0.222
156.27%
1 jan 1966 ano
0.406
+0.042
11.6%
1 jan 1967 ano
0.703
+0.297
73.01%
1 jan 1968 ano
1.827
+1.125
159.99%
1 jan 1969 ano
3.467
+1.639
89.71%
1 jan 1970 ano
2.48
-0.987
-28.46%
1 jan 1971 ano
3.53
+1.049
42.31%
1 jan 1972 ano
4.729
+1.199
33.98%
1 jan 1973 ano
4.468
-0.261
-5.53%
1 jan 1974 ano
8.507
+4.039
90.41%
1 jan 1975 ano
8.564
+0.058
0.68%
1 jan 1976 ano
8.263
-0.301
-3.52%
1 jan 1977 ano
8.602
+0.339
4.1%
1 jan 1978 ano
9.303
+0.701
8.15%
1 jan 1979 ano
10.884
+1.581
17.0%
1 jan 1980 ano
9.493
-1.391
-12.78%
1 jan 1981 ano
9.098
-0.395
-4.16%
1 jan 1982 ano
8.795
-0.303
-3.33%
1 jan 1983 ano
8.55
-0.245
-2.79%
1 jan 1984 ano
7.012
-1.538
-17.98%
1 jan 1985 ano
7.419
+0.407
5.81%
1 jan 1986 ano
7.612
+0.192
2.59%
1 jan 1987 ano
5.825
-1.787
-23.47%
1 jan 1988 ano
4.588
-1.237
-21.24%
1 jan 1989 ano
4.808
+0.221
4.81%
1 jan 1990 ano
6.229
+1.421
29.55%
1 jan 1991 ano
4.725
-1.504
-24.14%
1 jan 1992 ano
4.637
-0.088
-1.86%
1 jan 1993 ano
4.91
+0.273
5.88%
1 jan 1994 ano
4.839
-0.07
-1.44%
1 jan 1995 ano
4.146
-0.693
-14.32%
1 jan 1996 ano
4.256
+0.11
2.65%
1 jan 1997 ano
4.282
+0.026
0.62%
1 jan 1998 ano
4.193
-0.089
-2.08%
1 jan 1999 ano
4.245
+0.052
1.23%
1 jan 2000 ano
3.998
-0.247
-5.81%
1 jan 2001 ano
3.811
-0.187
-4.67%
1 jan 2002 ano
3.808
-0.003
-0.08%
1 jan 2003 ano
3.547
-0.261
-6.86%
1 jan 2004 ano
3.522
-0.025
-0.7%
1 jan 2005 ano
3.478
-0.044
-1.26%
1 jan 2006 ano
3.548
+0.07
2.01%
1 jan 2007 ano
2.962
-0.586
-16.52%
1 jan 2008 ano
2.858
-0.104
-3.51%
1 jan 2009 ano
2.827
-0.031
-1.1%
1 jan 2010 ano
2.873
+0.046
1.64%
1 jan 2011 ano
2.942
+0.069
2.4%
1 jan 2012 ano
2.834
-0.108
-3.66%
1 jan 2013 ano
2.839
+0.005
0.16%
1 jan 2014 ano
2.882
+0.043
1.52%
Classificação de países por estatísticas atuais por anos


Comentários: