29
/pt/
pt
AIzaSyAYiBZKx7MnpbEhh9jyipgxe19OcubqV5w
April 1, 2024
73715
Austria
AUT
true
2
1
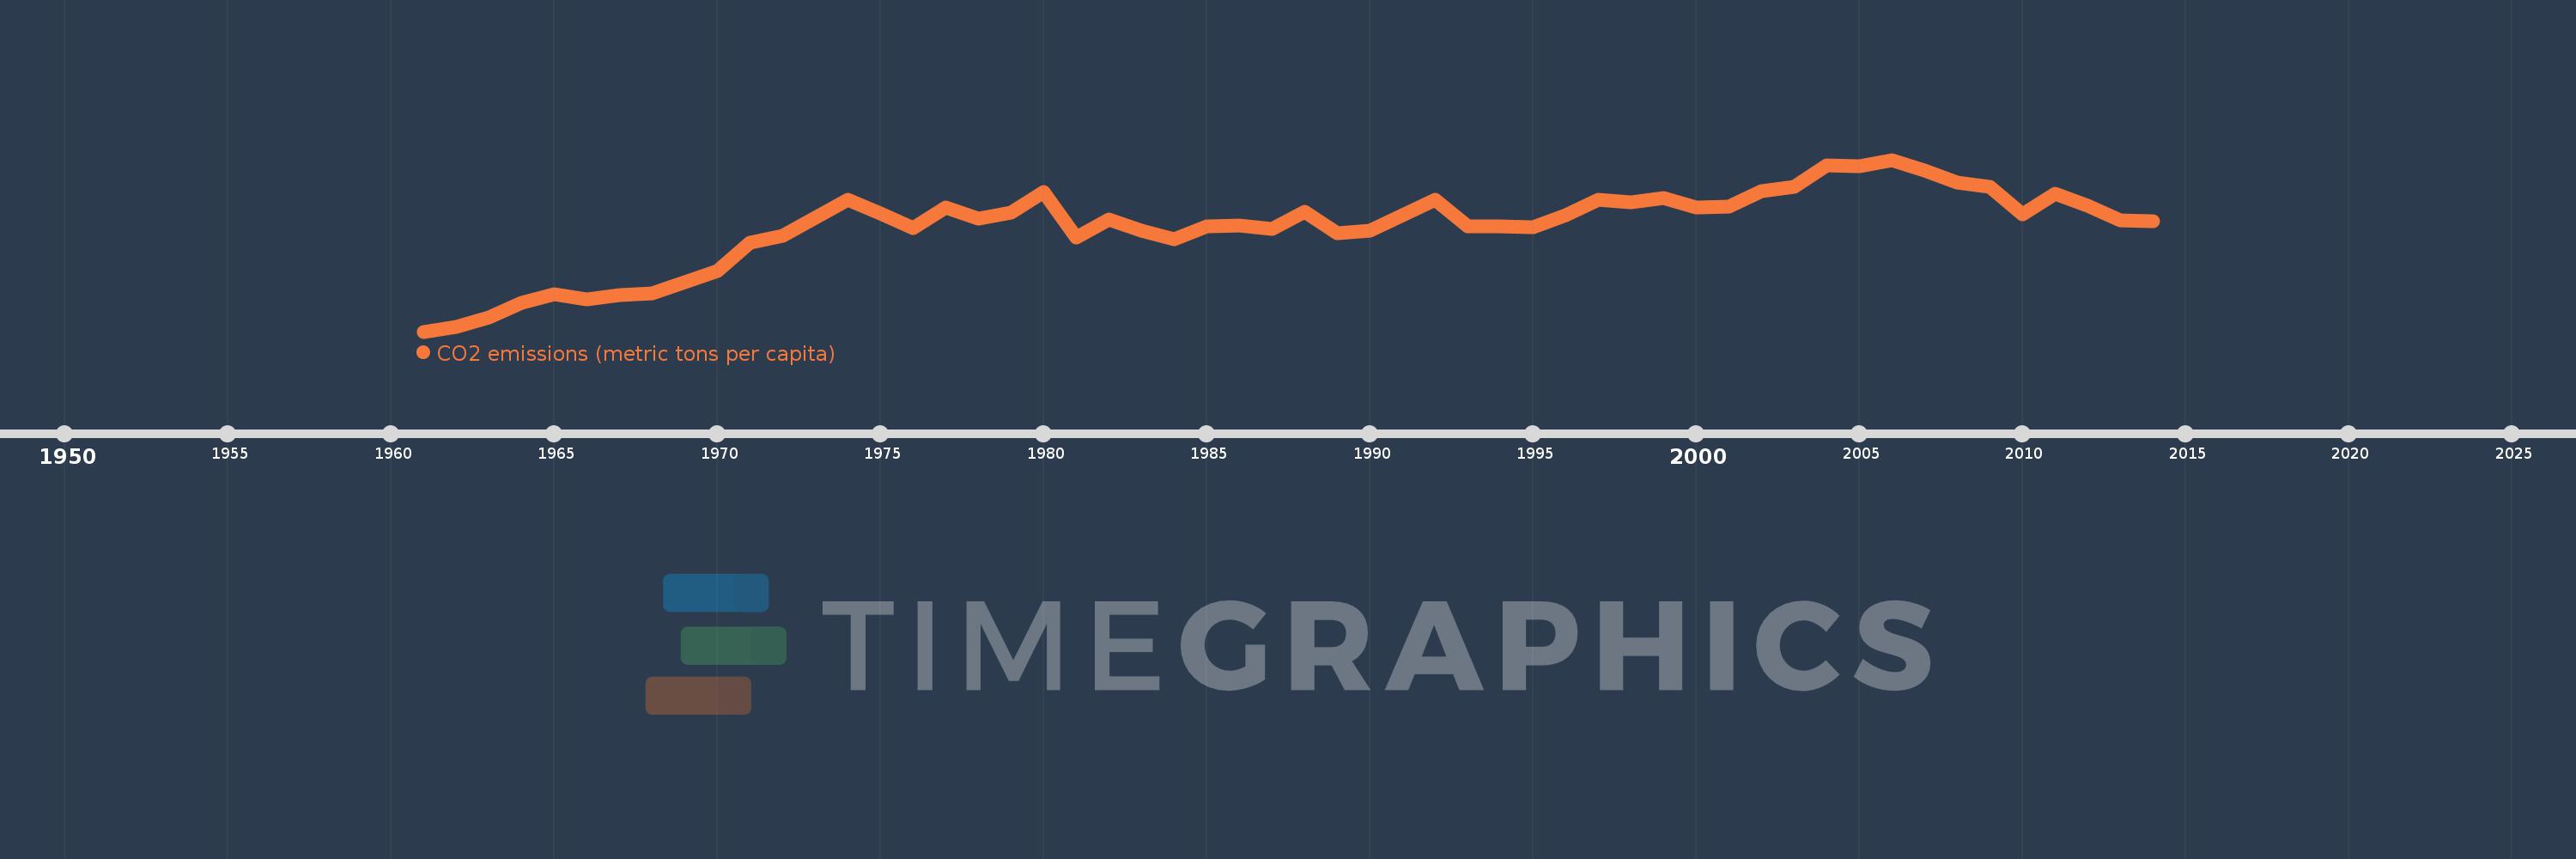
CO2 emissions (metric tons per capita)
2014,2013,2012,2011,2010,2009,2008,2007,2006,2005,2004,2003,2002,2001,2000,1999,1998,1997,1996,1995,1994,1993,1992,1991,1990,1989,1988,1987,1986,1985,1984,1983,1982,1981,1980,1979,1978,1977,1976,1975,1974,1973,1972,1971,1970,1969,1968,1967,1966,1965,1964,1963,1962,1961
Estas estatísticas em outros países:
AfghanistanAlbaniaAlgeriaAndorraAngolaAntigua and BarbudaArab WorldArgentinaArmeniaArubaAustraliaAustriaAzerbaijanBahamas, TheBahrainBangladeshBarbadosBelarusBelgiumBelizeBeninBermudaBhutanBoliviaBosnia and HerzegovinaBotswanaBrazilBritish Virgin IslandsBrunei DarussalamBulgariaBurkina FasoBurundiCabo VerdeCambodiaCameroonCanadaCaribbean small statesCayman IslandsCentral African RepublicCentral Europe and the BalticsChadChileChinaColombiaComorosCongo, Dem. Rep.Congo, Rep.Costa RicaCote d'IvoireCroatiaCubaCuracaoCyprusCzech RepublicDenmarkDjiboutiDominicaDominican RepublicEarly-demographic dividendEast Asia & PacificEast Asia & Pacific (excluding high income)East Asia & Pacific (IDA & IBRD countries)EcuadorEgypt, Arab Rep.El SalvadorEquatorial GuineaEritreaEstoniaEthiopiaEuro areaEurope & Central AsiaEurope & Central Asia (excluding high income)Europe & Central Asia (IDA & IBRD countries)European UnionFaroe IslandsFijiFinlandFragile and conflict affected situationsFranceFrench PolynesiaGabonGambia, TheGeorgiaGermanyGhanaGibraltarGreeceGreenlandGrenadaGuatemalaGuineaGuinea-BissauGuyanaHaitiHeavily indebted poor countries (HIPC)High incomeHondurasHong Kong SAR, ChinaHungaryIBRD onlyIcelandIDA & IBRD totalIDA blendIDA onlyIDA totalIndiaIndonesiaIran, Islamic Rep.IraqIrelandIsraelItalyJamaicaJapanJordanKazakhstanKenyaKiribatiKorea, Dem. People’s Rep.Korea, Rep.KuwaitKyrgyz RepublicLao PDRLate-demographic dividendLatin America & Caribbean Latin America & Caribbean (excluding high income)Latin America & the Caribbean (IDA & IBRD countries)LatviaLeast developed countries: UN classificationLebanonLesothoLiberiaLibyaLiechtensteinLithuaniaLow & middle incomeLow incomeLower middle incomeLuxembourgMacao SAR, ChinaMacedonia, FYRMadagascarMalawiMalaysiaMaldivesMaliMaltaMarshall IslandsMauritaniaMauritiusMexicoMicronesia, Fed. Sts.Middle East & North AfricaMiddle East & North Africa (excluding high income)Middle East & North Africa (IDA & IBRD countries)Middle incomeMoldovaMongoliaMontenegroMoroccoMozambiqueMyanmarNamibiaNauruNepalNetherlandsNew CaledoniaNew ZealandNicaraguaNigerNigeriaNorth AmericaNorwayOECD membersOmanOther small statesPacific island small statesPakistanPalauPanamaPapua New GuineaParaguayPeruPhilippinesPolandPortugalPost-demographic dividendPre-demographic dividendQatarRomaniaRussian FederationRwandaSamoaSao Tome and PrincipeSaudi ArabiaSenegalSerbiaSeychellesSierra LeoneSingaporeSint Maarten (Dutch part)Slovak RepublicSloveniaSmall statesSolomon IslandsSomaliaSouth AfricaSouth AsiaSouth Asia (IDA & IBRD)South SudanSpainSri LankaSt. Kitts and NevisSt. LuciaSt. Vincent and the GrenadinesSub-Saharan Africa Sub-Saharan Africa (excluding high income)Sub-Saharan Africa (IDA & IBRD countries)SudanSurinameSwazilandSwedenSwitzerlandSyrian Arab RepublicTajikistanTanzaniaThailandTimor-LesteTogoTongaTrinidad and TobagoTunisiaTurkeyTurkmenistanTurks and Caicos IslandsUgandaUkraineUnited Arab EmiratesUnited KingdomUnited StatesUpper middle incomeUruguayUzbekistanVanuatuVenezuela, RBVietnamWest Bank and GazaWorldYemen, Rep.ZambiaZimbabwe Linha do tempo:
Nesta escala de tempo está apresentado um gráfico de 1961 ano até 2014 ano Austria. Dados de 1960 ano ausente. O número de observações reais por data: 54.
Fonte (nome):
Indicadores de desenvolvimento mundial
Fonte (organização):
Carbon Dioxide Information Analysis Center, Environmental Sciences Division, Oak Ridge National Laboratory, Tennessee, United States.
Categorias:
Climate Change, Environment
Foi atualizado:
23 abr 2017 ano
Indicadores de alterações dos valores ao longo dos anos
Mínimo:
4.373
1 jan 1961 ano
Máximo:
9.02
1 jan 2006 ano
Na data de observação
Valor
Mudança absoluta
A alteração em relação ao valor anterior
1 jan 1961 ano
4.373
+4.373
0.0%
1 jan 1962 ano
4.496
+0.123
2.81%
1 jan 1963 ano
4.755
+0.259
5.76%
1 jan 1964 ano
5.155
+0.4
8.41%
1 jan 1965 ano
5.391
+0.236
4.57%
1 jan 1966 ano
5.252
-0.139
-2.57%
1 jan 1967 ano
5.362
+0.11
2.09%
1 jan 1968 ano
5.418
+0.056
1.04%
1 jan 1969 ano
5.711
+0.293
5.42%
1 jan 1970 ano
6.006
+0.295
5.17%
1 jan 1971 ano
6.789
+0.782
13.03%
1 jan 1972 ano
6.954
+0.165
2.43%
1 jan 1973 ano
7.449
+0.495
7.12%
1 jan 1974 ano
7.931
+0.482
6.48%
1 jan 1975 ano
7.563
-0.368
-4.64%
1 jan 1976 ano
7.177
-0.386
-5.1%
1 jan 1977 ano
7.721
+0.544
7.59%
1 jan 1978 ano
7.428
-0.293
-3.8%
1 jan 1979 ano
7.601
+0.173
2.33%
1 jan 1980 ano
8.159
+0.557
7.33%
1 jan 1981 ano
6.928
-1.23
-15.08%
1 jan 1982 ano
7.416
+0.488
7.04%
1 jan 1983 ano
7.112
-0.304
-4.1%
1 jan 1984 ano
6.874
-0.238
-3.34%
1 jan 1985 ano
7.214
+0.34
4.94%
1 jan 1986 ano
7.231
+0.016
0.23%
1 jan 1987 ano
7.144
-0.086
-1.2%
1 jan 1988 ano
7.623
+0.479
6.71%
1 jan 1989 ano
7.032
-0.591
-7.76%
1 jan 1990 ano
7.102
+0.07
1.0%
1 jan 1991 ano
7.513
+0.411
5.78%
1 jan 1992 ano
7.944
+0.431
5.73%
1 jan 1993 ano
7.226
-0.718
-9.04%
1 jan 1994 ano
7.223
-0.003
-0.04%
1 jan 1995 ano
7.189
-0.034
-0.47%
1 jan 1996 ano
7.522
+0.332
4.62%
1 jan 1997 ano
7.938
+0.416
5.54%
1 jan 1998 ano
7.864
-0.074
-0.94%
1 jan 1999 ano
7.981
+0.117
1.49%
1 jan 2000 ano
7.741
-0.24
-3.01%
1 jan 2001 ano
7.755
+0.014
0.19%
1 jan 2002 ano
8.173
+0.417
5.38%
1 jan 2003 ano
8.279
+0.106
1.3%
1 jan 2004 ano
8.868
+0.589
7.12%
1 jan 2005 ano
8.836
-0.032
-0.36%
1 jan 2006 ano
9.02
+0.184
2.08%
1 jan 2007 ano
8.727
-0.293
-3.25%
1 jan 2008 ano
8.405
-0.322
-3.69%
1 jan 2009 ano
8.287
-0.118
-1.41%
1 jan 2010 ano
7.556
-0.731
-8.82%
1 jan 2011 ano
8.111
+0.555
7.34%
1 jan 2012 ano
7.777
-0.334
-4.12%
1 jan 2013 ano
7.384
-0.393
-5.05%
1 jan 2014 ano
7.36
-0.024
-0.32%
Classificação de países por estatísticas atuais por anos


Comentários: