29
/pt/
pt
AIzaSyAYiBZKx7MnpbEhh9jyipgxe19OcubqV5w
April 1, 2024
65761
Algeria
DZA
true
2
1
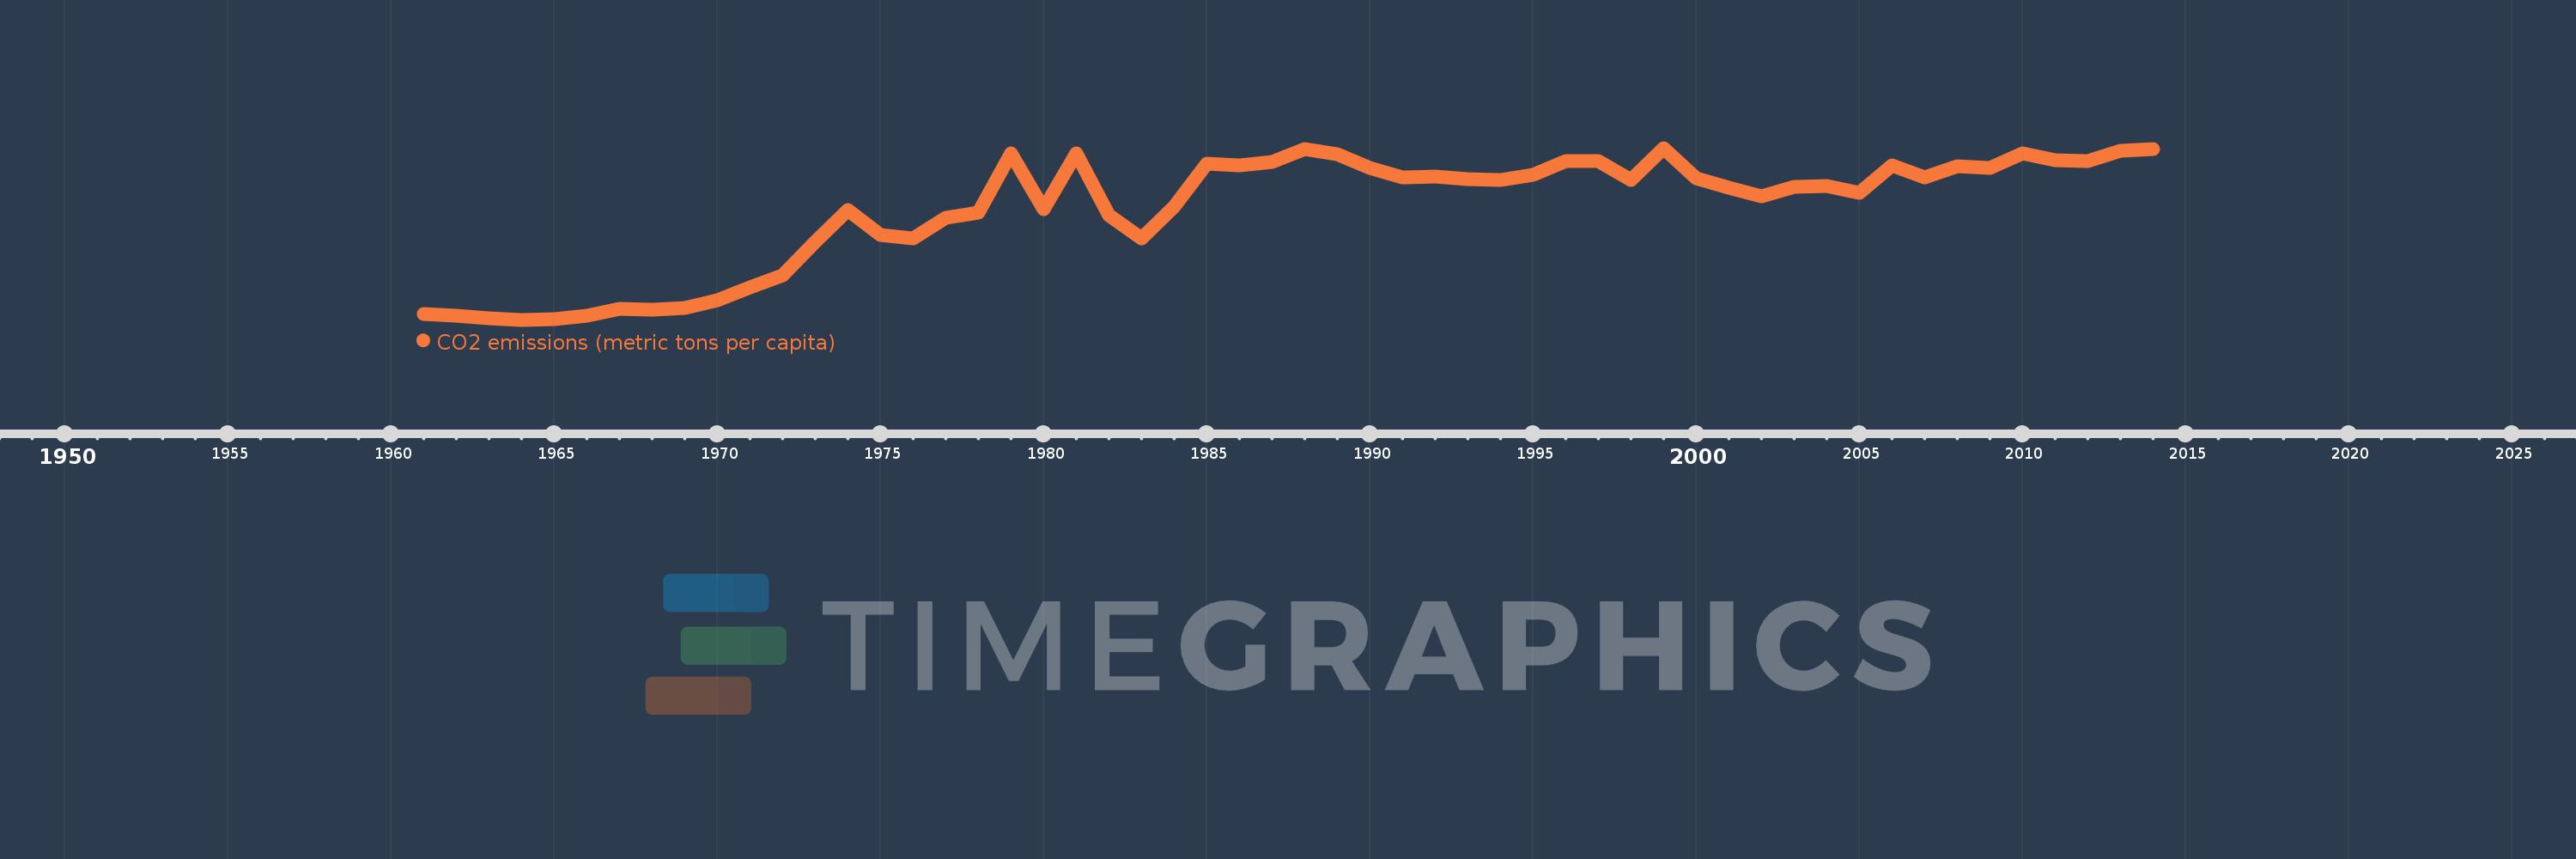
CO2 emissions (metric tons per capita)
2014,2013,2012,2011,2010,2009,2008,2007,2006,2005,2004,2003,2002,2001,2000,1999,1998,1997,1996,1995,1994,1993,1992,1991,1990,1989,1988,1987,1986,1985,1984,1983,1982,1981,1980,1979,1978,1977,1976,1975,1974,1973,1972,1971,1970,1969,1968,1967,1966,1965,1964,1963,1962,1961
Estas estatísticas em outros países:
AfghanistanAlbaniaAlgeriaAndorraAngolaAntigua and BarbudaArab WorldArgentinaArmeniaArubaAustraliaAustriaAzerbaijanBahamas, TheBahrainBangladeshBarbadosBelarusBelgiumBelizeBeninBermudaBhutanBoliviaBosnia and HerzegovinaBotswanaBrazilBritish Virgin IslandsBrunei DarussalamBulgariaBurkina FasoBurundiCabo VerdeCambodiaCameroonCanadaCaribbean small statesCayman IslandsCentral African RepublicCentral Europe and the BalticsChadChileChinaColombiaComorosCongo, Dem. Rep.Congo, Rep.Costa RicaCote d'IvoireCroatiaCubaCuracaoCyprusCzech RepublicDenmarkDjiboutiDominicaDominican RepublicEarly-demographic dividendEast Asia & PacificEast Asia & Pacific (excluding high income)East Asia & Pacific (IDA & IBRD countries)EcuadorEgypt, Arab Rep.El SalvadorEquatorial GuineaEritreaEstoniaEthiopiaEuro areaEurope & Central AsiaEurope & Central Asia (excluding high income)Europe & Central Asia (IDA & IBRD countries)European UnionFaroe IslandsFijiFinlandFragile and conflict affected situationsFranceFrench PolynesiaGabonGambia, TheGeorgiaGermanyGhanaGibraltarGreeceGreenlandGrenadaGuatemalaGuineaGuinea-BissauGuyanaHaitiHeavily indebted poor countries (HIPC)High incomeHondurasHong Kong SAR, ChinaHungaryIBRD onlyIcelandIDA & IBRD totalIDA blendIDA onlyIDA totalIndiaIndonesiaIran, Islamic Rep.IraqIrelandIsraelItalyJamaicaJapanJordanKazakhstanKenyaKiribatiKorea, Dem. People’s Rep.Korea, Rep.KuwaitKyrgyz RepublicLao PDRLate-demographic dividendLatin America & Caribbean Latin America & Caribbean (excluding high income)Latin America & the Caribbean (IDA & IBRD countries)LatviaLeast developed countries: UN classificationLebanonLesothoLiberiaLibyaLiechtensteinLithuaniaLow & middle incomeLow incomeLower middle incomeLuxembourgMacao SAR, ChinaMacedonia, FYRMadagascarMalawiMalaysiaMaldivesMaliMaltaMarshall IslandsMauritaniaMauritiusMexicoMicronesia, Fed. Sts.Middle East & North AfricaMiddle East & North Africa (excluding high income)Middle East & North Africa (IDA & IBRD countries)Middle incomeMoldovaMongoliaMontenegroMoroccoMozambiqueMyanmarNamibiaNauruNepalNetherlandsNew CaledoniaNew ZealandNicaraguaNigerNigeriaNorth AmericaNorwayOECD membersOmanOther small statesPacific island small statesPakistanPalauPanamaPapua New GuineaParaguayPeruPhilippinesPolandPortugalPost-demographic dividendPre-demographic dividendQatarRomaniaRussian FederationRwandaSamoaSao Tome and PrincipeSaudi ArabiaSenegalSerbiaSeychellesSierra LeoneSingaporeSint Maarten (Dutch part)Slovak RepublicSloveniaSmall statesSolomon IslandsSomaliaSouth AfricaSouth AsiaSouth Asia (IDA & IBRD)South SudanSpainSri LankaSt. Kitts and NevisSt. LuciaSt. Vincent and the GrenadinesSub-Saharan Africa Sub-Saharan Africa (excluding high income)Sub-Saharan Africa (IDA & IBRD countries)SudanSurinameSwazilandSwedenSwitzerlandSyrian Arab RepublicTajikistanTanzaniaThailandTimor-LesteTogoTongaTrinidad and TobagoTunisiaTurkeyTurkmenistanTurks and Caicos IslandsUgandaUkraineUnited Arab EmiratesUnited KingdomUnited StatesUpper middle incomeUruguayUzbekistanVanuatuVenezuela, RBVietnamWest Bank and GazaWorldYemen, Rep.ZambiaZimbabwe Linha do tempo:
Nesta escala de tempo está apresentado um gráfico de 1961 ano até 2014 ano Algeria. Dados de 1960 ano ausente. O número de observações reais por data: 54.
Fonte (nome):
Indicadores de desenvolvimento mundial
Fonte (organização):
Carbon Dioxide Information Analysis Center, Environmental Sciences Division, Oak Ridge National Laboratory, Tennessee, United States.
Categorias:
Climate Change, Environment
Foi atualizado:
23 abr 2017 ano
Indicadores de alterações dos valores ao longo dos anos
Mínimo:
0.453
1 jan 1964 ano
Máximo:
3.53
1 jan 1999 ano
Na data de observação
Valor
Mudança absoluta
A alteração em relação ao valor anterior
1 jan 1961 ano
0.554
+0.554
0.0%
1 jan 1962 ano
0.532
-0.022
-3.96%
1 jan 1963 ano
0.485
-0.047
-8.81%
1 jan 1964 ano
0.453
-0.032
-6.63%
1 jan 1965 ano
0.46
+0.007
1.49%
1 jan 1966 ano
0.522
+0.063
13.68%
1 jan 1967 ano
0.649
+0.127
24.31%
1 jan 1968 ano
0.632
-0.017
-2.67%
1 jan 1969 ano
0.659
+0.027
4.29%
1 jan 1970 ano
0.797
+0.138
20.92%
1 jan 1971 ano
1.036
+0.239
29.96%
1 jan 1972 ano
1.248
+0.212
20.44%
1 jan 1973 ano
1.844
+0.596
47.74%
1 jan 1974 ano
2.424
+0.581
31.49%
1 jan 1975 ano
1.964
-0.46
-18.99%
1 jan 1976 ano
1.917
-0.047
-2.38%
1 jan 1977 ano
2.279
+0.362
18.87%
1 jan 1978 ano
2.368
+0.089
3.92%
1 jan 1979 ano
3.433
+1.065
44.99%
1 jan 1980 ano
2.432
-1.002
-29.17%
1 jan 1981 ano
3.44
+1.008
41.46%
1 jan 1982 ano
2.329
-1.111
-32.31%
1 jan 1983 ano
1.909
-0.42
-18.04%
1 jan 1984 ano
2.479
+0.57
29.89%
1 jan 1985 ano
3.248
+0.769
31.01%
1 jan 1986 ano
3.225
-0.022
-0.68%
1 jan 1987 ano
3.282
+0.056
1.75%
1 jan 1988 ano
3.517
+0.235
7.16%
1 jan 1989 ano
3.414
-0.103
-2.94%
1 jan 1990 ano
3.169
-0.245
-7.16%
1 jan 1991 ano
3.008
-0.161
-5.09%
1 jan 1992 ano
3.02
+0.012
0.4%
1 jan 1993 ano
2.976
-0.044
-1.46%
1 jan 1994 ano
2.962
-0.014
-0.48%
1 jan 1995 ano
3.05
+0.088
2.98%
1 jan 1996 ano
3.299
+0.249
8.16%
1 jan 1997 ano
3.302
+0.004
0.12%
1 jan 1998 ano
2.951
-0.352
-10.65%
1 jan 1999 ano
3.53
+0.579
19.62%
1 jan 2000 ano
2.994
-0.536
-15.17%
1 jan 2001 ano
2.82
-0.174
-5.82%
1 jan 2002 ano
2.668
-0.151
-5.37%
1 jan 2003 ano
2.84
+0.172
6.43%
1 jan 2004 ano
2.856
+0.016
0.58%
1 jan 2005 ano
2.727
-0.129
-4.53%
1 jan 2006 ano
3.22
+0.493
18.08%
1 jan 2007 ano
2.998
-0.223
-6.91%
1 jan 2008 ano
3.196
+0.198
6.62%
1 jan 2009 ano
3.169
-0.027
-0.86%
1 jan 2010 ano
3.43
+0.262
8.26%
1 jan 2011 ano
3.307
-0.123
-3.58%
1 jan 2012 ano
3.301
-0.007
-0.2%
1 jan 2013 ano
3.472
+0.171
5.19%
1 jan 2014 ano
3.515
+0.043
1.23%
Classificação de países por estatísticas atuais por anos


Comentários: