29
/pt/
pt
AIzaSyAYiBZKx7MnpbEhh9jyipgxe19OcubqV5w
April 1, 2024
123241
Ecuador
ECU
true
2
1
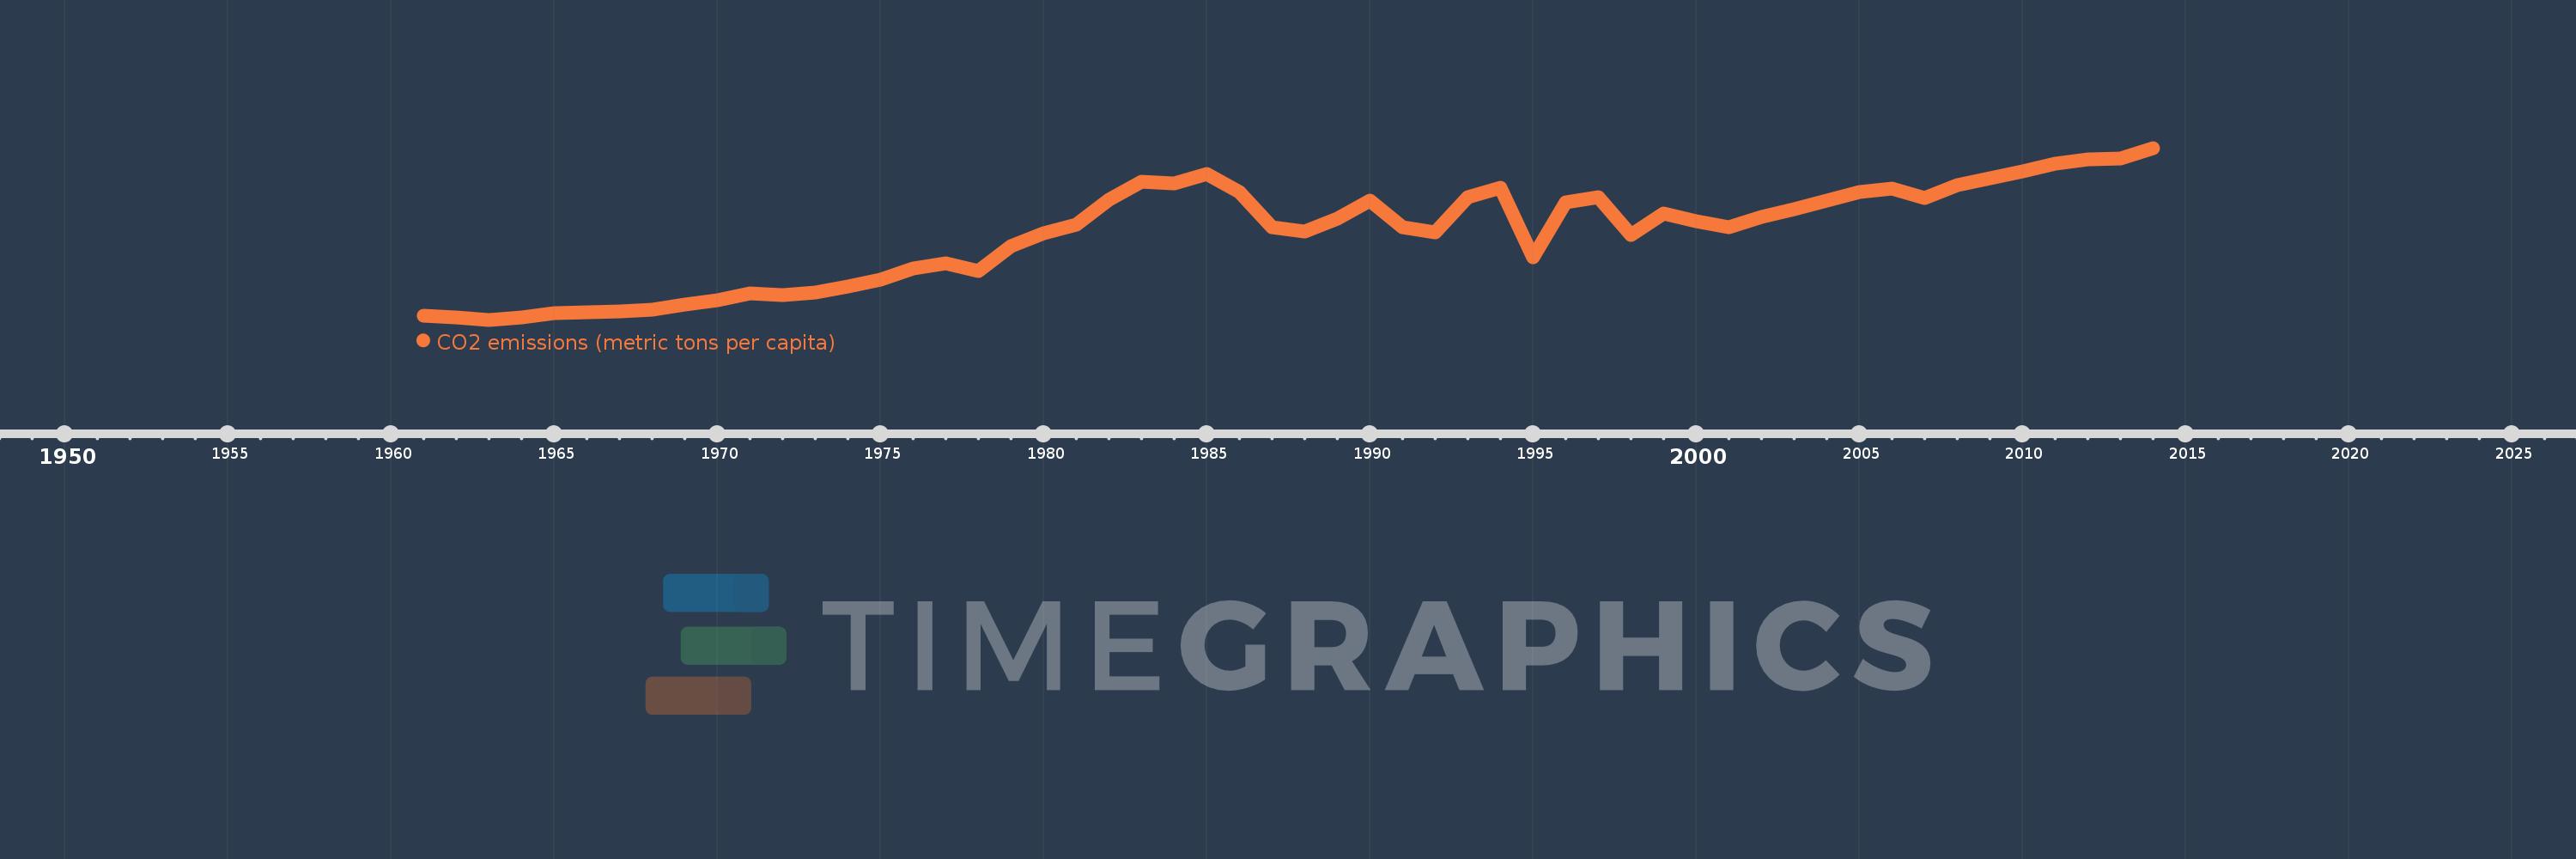
CO2 emissions (metric tons per capita)
2014,2013,2012,2011,2010,2009,2008,2007,2006,2005,2004,2003,2002,2001,2000,1999,1998,1997,1996,1995,1994,1993,1992,1991,1990,1989,1988,1987,1986,1985,1984,1983,1982,1981,1980,1979,1978,1977,1976,1975,1974,1973,1972,1971,1970,1969,1968,1967,1966,1965,1964,1963,1962,1961
Estas estatísticas em outros países:
AfghanistanAlbaniaAlgeriaAndorraAngolaAntigua and BarbudaArab WorldArgentinaArmeniaArubaAustraliaAustriaAzerbaijanBahamas, TheBahrainBangladeshBarbadosBelarusBelgiumBelizeBeninBermudaBhutanBoliviaBosnia and HerzegovinaBotswanaBrazilBritish Virgin IslandsBrunei DarussalamBulgariaBurkina FasoBurundiCabo VerdeCambodiaCameroonCanadaCaribbean small statesCayman IslandsCentral African RepublicCentral Europe and the BalticsChadChileChinaColombiaComorosCongo, Dem. Rep.Congo, Rep.Costa RicaCote d'IvoireCroatiaCubaCuracaoCyprusCzech RepublicDenmarkDjiboutiDominicaDominican RepublicEarly-demographic dividendEast Asia & PacificEast Asia & Pacific (excluding high income)East Asia & Pacific (IDA & IBRD countries)EcuadorEgypt, Arab Rep.El SalvadorEquatorial GuineaEritreaEstoniaEthiopiaEuro areaEurope & Central AsiaEurope & Central Asia (excluding high income)Europe & Central Asia (IDA & IBRD countries)European UnionFaroe IslandsFijiFinlandFragile and conflict affected situationsFranceFrench PolynesiaGabonGambia, TheGeorgiaGermanyGhanaGibraltarGreeceGreenlandGrenadaGuatemalaGuineaGuinea-BissauGuyanaHaitiHeavily indebted poor countries (HIPC)High incomeHondurasHong Kong SAR, ChinaHungaryIBRD onlyIcelandIDA & IBRD totalIDA blendIDA onlyIDA totalIndiaIndonesiaIran, Islamic Rep.IraqIrelandIsraelItalyJamaicaJapanJordanKazakhstanKenyaKiribatiKorea, Dem. People’s Rep.Korea, Rep.KuwaitKyrgyz RepublicLao PDRLate-demographic dividendLatin America & Caribbean Latin America & Caribbean (excluding high income)Latin America & the Caribbean (IDA & IBRD countries)LatviaLeast developed countries: UN classificationLebanonLesothoLiberiaLibyaLiechtensteinLithuaniaLow & middle incomeLow incomeLower middle incomeLuxembourgMacao SAR, ChinaMacedonia, FYRMadagascarMalawiMalaysiaMaldivesMaliMaltaMarshall IslandsMauritaniaMauritiusMexicoMicronesia, Fed. Sts.Middle East & North AfricaMiddle East & North Africa (excluding high income)Middle East & North Africa (IDA & IBRD countries)Middle incomeMoldovaMongoliaMontenegroMoroccoMozambiqueMyanmarNamibiaNauruNepalNetherlandsNew CaledoniaNew ZealandNicaraguaNigerNigeriaNorth AmericaNorwayOECD membersOmanOther small statesPacific island small statesPakistanPalauPanamaPapua New GuineaParaguayPeruPhilippinesPolandPortugalPost-demographic dividendPre-demographic dividendQatarRomaniaRussian FederationRwandaSamoaSao Tome and PrincipeSaudi ArabiaSenegalSerbiaSeychellesSierra LeoneSingaporeSint Maarten (Dutch part)Slovak RepublicSloveniaSmall statesSolomon IslandsSomaliaSouth AfricaSouth AsiaSouth Asia (IDA & IBRD)South SudanSpainSri LankaSt. Kitts and NevisSt. LuciaSt. Vincent and the GrenadinesSub-Saharan Africa Sub-Saharan Africa (excluding high income)Sub-Saharan Africa (IDA & IBRD countries)SudanSurinameSwazilandSwedenSwitzerlandSyrian Arab RepublicTajikistanTanzaniaThailandTimor-LesteTogoTongaTrinidad and TobagoTunisiaTurkeyTurkmenistanTurks and Caicos IslandsUgandaUkraineUnited Arab EmiratesUnited KingdomUnited StatesUpper middle incomeUruguayUzbekistanVanuatuVenezuela, RBVietnamWest Bank and GazaWorldYemen, Rep.ZambiaZimbabwe Linha do tempo:
Nesta escala de tempo está apresentado um gráfico de 1961 ano até 2014 ano Ecuador. Dados de 1960 ano ausente. O número de observações reais por data: 54.
Fonte (nome):
Indicadores de desenvolvimento mundial
Fonte (organização):
Carbon Dioxide Information Analysis Center, Environmental Sciences Division, Oak Ridge National Laboratory, Tennessee, United States.
Categorias:
Climate Change, Environment
Foi atualizado:
23 abr 2017 ano
Indicadores de alterações dos valores ao longo dos anos
Mínimo:
0.325
1 jan 1963 ano
Máximo:
2.779
1 jan 2014 ano
Na data de observação
Valor
Mudança absoluta
A alteração em relação ao valor anterior
1 jan 1961 ano
0.388
+0.388
0.0%
1 jan 1962 ano
0.352
-0.036
-9.27%
1 jan 1963 ano
0.325
-0.027
-7.59%
1 jan 1964 ano
0.363
+0.037
11.49%
1 jan 1965 ano
0.421
+0.058
15.98%
1 jan 1966 ano
0.434
+0.013
3.11%
1 jan 1967 ano
0.448
+0.014
3.22%
1 jan 1968 ano
0.466
+0.018
4.03%
1 jan 1969 ano
0.544
+0.078
16.77%
1 jan 1970 ano
0.609
+0.065
11.99%
1 jan 1971 ano
0.705
+0.096
15.79%
1 jan 1972 ano
0.676
-0.029
-4.15%
1 jan 1973 ano
0.715
+0.039
5.72%
1 jan 1974 ano
0.796
+0.081
11.35%
1 jan 1975 ano
0.896
+0.1
12.58%
1 jan 1976 ano
1.054
+0.158
17.62%
1 jan 1977 ano
1.13
+0.076
7.21%
1 jan 1978 ano
1.015
-0.115
-10.17%
1 jan 1979 ano
1.377
+0.362
35.66%
1 jan 1980 ano
1.565
+0.189
13.69%
1 jan 1981 ano
1.685
+0.12
7.67%
1 jan 1982 ano
2.04
+0.354
21.03%
1 jan 1983 ano
2.298
+0.258
12.67%
1 jan 1984 ano
2.272
-0.026
-1.12%
1 jan 1985 ano
2.409
+0.137
6.02%
1 jan 1986 ano
2.148
-0.261
-10.84%
1 jan 1987 ano
1.647
-0.501
-23.31%
1 jan 1988 ano
1.59
-0.057
-3.46%
1 jan 1989 ano
1.773
+0.183
11.51%
1 jan 1990 ano
2.031
+0.258
14.54%
1 jan 1991 ano
1.647
-0.384
-18.93%
1 jan 1992 ano
1.577
-0.07
-4.24%
1 jan 1993 ano
2.081
+0.504
31.97%
1 jan 1994 ano
2.21
+0.129
6.2%
1 jan 1995 ano
1.219
-0.991
-44.83%
1 jan 1996 ano
1.997
+0.777
63.74%
1 jan 1997 ano
2.071
+0.074
3.71%
1 jan 1998 ano
1.54
-0.531
-25.64%
1 jan 1999 ano
1.846
+0.307
19.93%
1 jan 2000 ano
1.734
-0.113
-6.11%
1 jan 2001 ano
1.641
-0.093
-5.37%
1 jan 2002 ano
1.799
+0.158
9.63%
1 jan 2003 ano
1.909
+0.11
6.12%
1 jan 2004 ano
2.029
+0.121
6.31%
1 jan 2005 ano
2.15
+0.121
5.96%
1 jan 2006 ano
2.203
+0.053
2.48%
1 jan 2007 ano
2.066
-0.137
-6.23%
1 jan 2008 ano
2.245
+0.179
8.64%
1 jan 2009 ano
2.344
+0.099
4.43%
1 jan 2010 ano
2.448
+0.104
4.44%
1 jan 2011 ano
2.549
+0.101
4.13%
1 jan 2012 ano
2.612
+0.062
2.45%
1 jan 2013 ano
2.625
+0.013
0.5%
1 jan 2014 ano
2.779
+0.155
5.89%
Classificação de países por estatísticas atuais por anos


Comentários: