29
/pt/
pt
AIzaSyAYiBZKx7MnpbEhh9jyipgxe19OcubqV5w
April 1, 2024
267739
Tunisia
TUN
true
2
1
CO2 emissions (metric tons per capita)
2014,2013,2012,2011,2010,2009,2008,2007,2006,2005,2004,2003,2002,2001,2000,1999,1998,1997,1996,1995,1994,1993,1992,1991,1990,1989,1988,1987,1986,1985,1984,1983,1982,1981,1980,1979,1978,1977,1976,1975,1974,1973,1972,1971,1970,1969,1968,1967,1966,1965,1964,1963,1962,1961
Estas estatísticas em outros países:
AfghanistanAlbaniaAlgeriaAndorraAngolaAntigua and BarbudaArab WorldArgentinaArmeniaArubaAustraliaAustriaAzerbaijanBahamas, TheBahrainBangladeshBarbadosBelarusBelgiumBelizeBeninBermudaBhutanBoliviaBosnia and HerzegovinaBotswanaBrazilBritish Virgin IslandsBrunei DarussalamBulgariaBurkina FasoBurundiCabo VerdeCambodiaCameroonCanadaCaribbean small statesCayman IslandsCentral African RepublicCentral Europe and the BalticsChadChileChinaColombiaComorosCongo, Dem. Rep.Congo, Rep.Costa RicaCote d'IvoireCroatiaCubaCuracaoCyprusCzech RepublicDenmarkDjiboutiDominicaDominican RepublicEarly-demographic dividendEast Asia & PacificEast Asia & Pacific (excluding high income)East Asia & Pacific (IDA & IBRD countries)EcuadorEgypt, Arab Rep.El SalvadorEquatorial GuineaEritreaEstoniaEthiopiaEuro areaEurope & Central AsiaEurope & Central Asia (excluding high income)Europe & Central Asia (IDA & IBRD countries)European UnionFaroe IslandsFijiFinlandFragile and conflict affected situationsFranceFrench PolynesiaGabonGambia, TheGeorgiaGermanyGhanaGibraltarGreeceGreenlandGrenadaGuatemalaGuineaGuinea-BissauGuyanaHaitiHeavily indebted poor countries (HIPC)High incomeHondurasHong Kong SAR, ChinaHungaryIBRD onlyIcelandIDA & IBRD totalIDA blendIDA onlyIDA totalIndiaIndonesiaIran, Islamic Rep.IraqIrelandIsraelItalyJamaicaJapanJordanKazakhstanKenyaKiribatiKorea, Dem. People’s Rep.Korea, Rep.KuwaitKyrgyz RepublicLao PDRLate-demographic dividendLatin America & Caribbean Latin America & Caribbean (excluding high income)Latin America & the Caribbean (IDA & IBRD countries)LatviaLeast developed countries: UN classificationLebanonLesothoLiberiaLibyaLiechtensteinLithuaniaLow & middle incomeLow incomeLower middle incomeLuxembourgMacao SAR, ChinaMacedonia, FYRMadagascarMalawiMalaysiaMaldivesMaliMaltaMarshall IslandsMauritaniaMauritiusMexicoMicronesia, Fed. Sts.Middle East & North AfricaMiddle East & North Africa (excluding high income)Middle East & North Africa (IDA & IBRD countries)Middle incomeMoldovaMongoliaMontenegroMoroccoMozambiqueMyanmarNamibiaNauruNepalNetherlandsNew CaledoniaNew ZealandNicaraguaNigerNigeriaNorth AmericaNorwayOECD membersOmanOther small statesPacific island small statesPakistanPalauPanamaPapua New GuineaParaguayPeruPhilippinesPolandPortugalPost-demographic dividendPre-demographic dividendQatarRomaniaRussian FederationRwandaSamoaSao Tome and PrincipeSaudi ArabiaSenegalSerbiaSeychellesSierra LeoneSingaporeSint Maarten (Dutch part)Slovak RepublicSloveniaSmall statesSolomon IslandsSomaliaSouth AfricaSouth AsiaSouth Asia (IDA & IBRD)South SudanSpainSri LankaSt. Kitts and NevisSt. LuciaSt. Vincent and the GrenadinesSub-Saharan Africa Sub-Saharan Africa (excluding high income)Sub-Saharan Africa (IDA & IBRD countries)SudanSurinameSwazilandSwedenSwitzerlandSyrian Arab RepublicTajikistanTanzaniaThailandTimor-LesteTogoTongaTrinidad and TobagoTunisiaTurkeyTurkmenistanTurks and Caicos IslandsUgandaUkraineUnited Arab EmiratesUnited KingdomUnited StatesUpper middle incomeUruguayUzbekistanVanuatuVenezuela, RBVietnamWest Bank and GazaWorldYemen, Rep.ZambiaZimbabwe Linha do tempo:
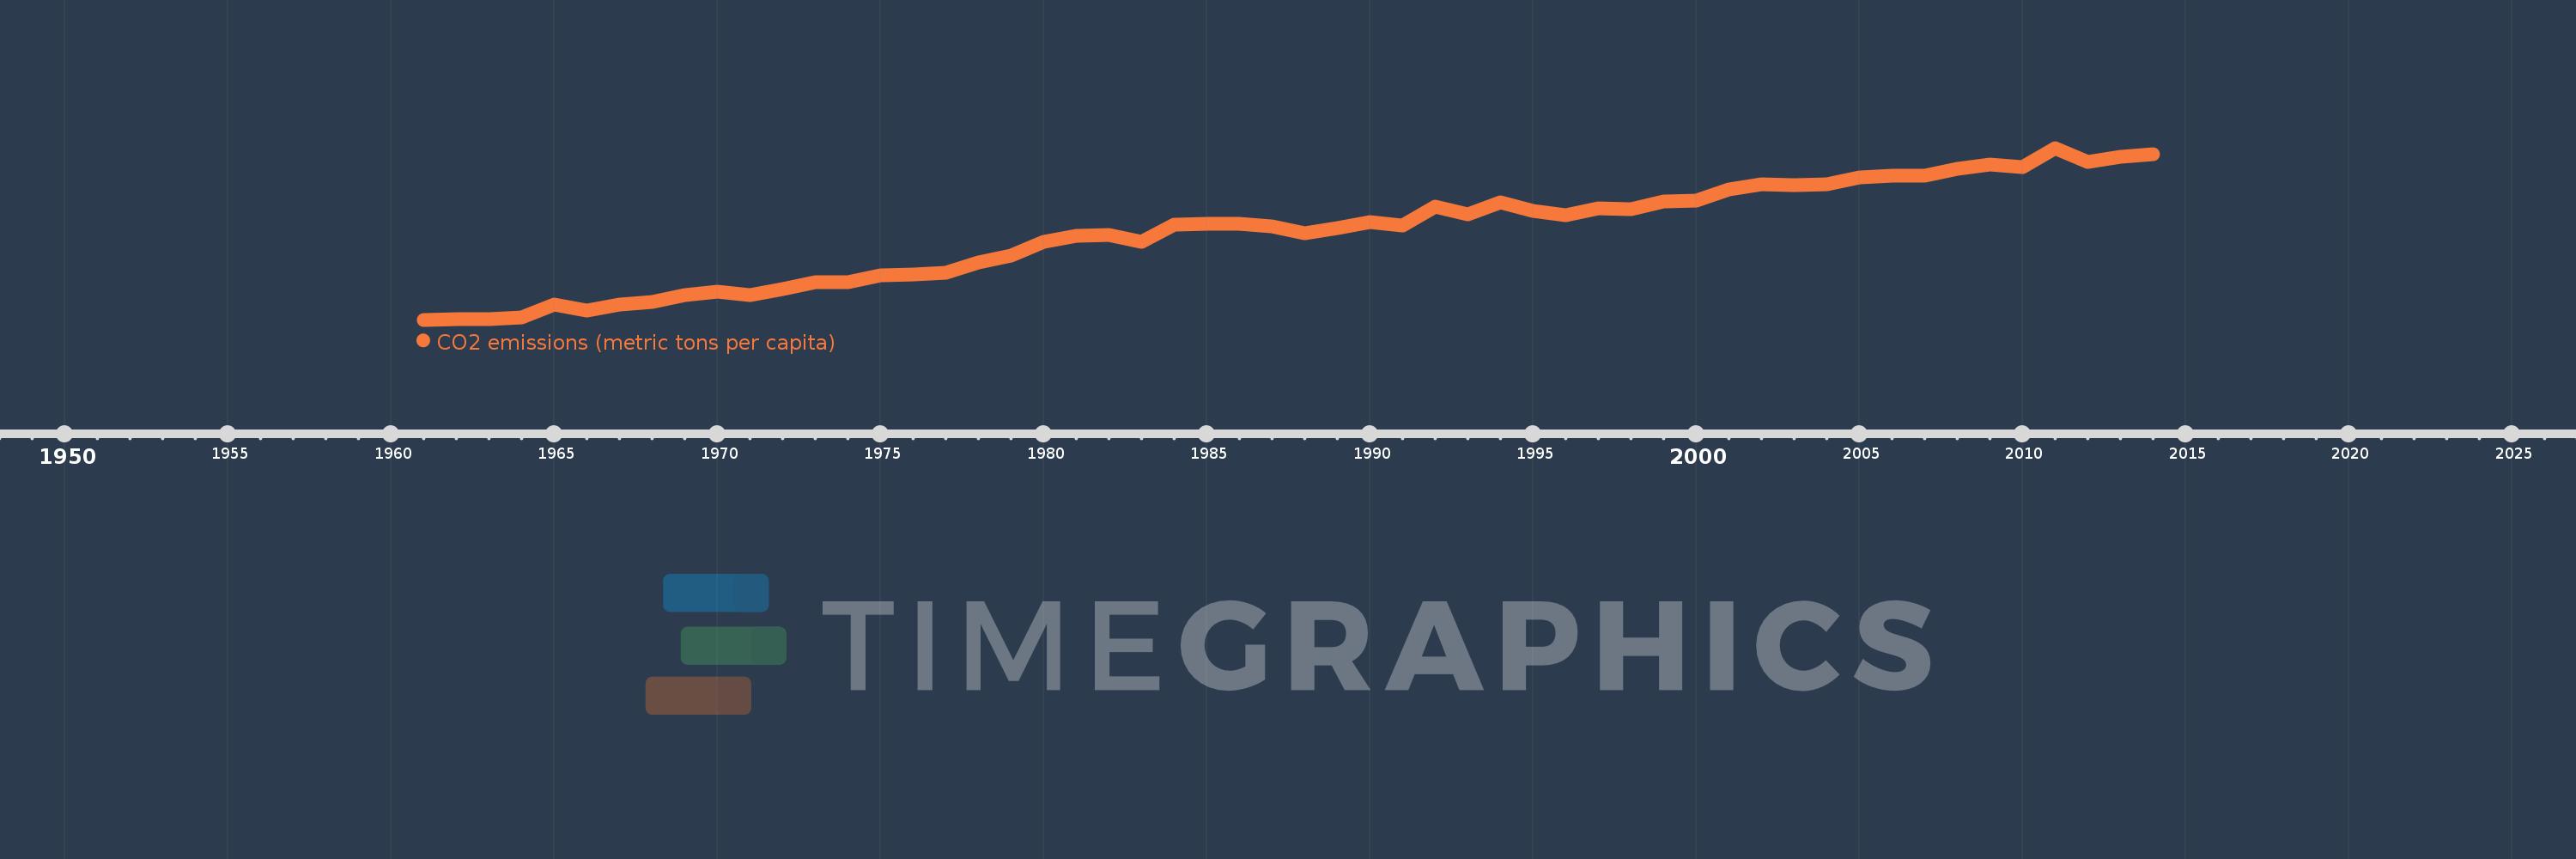
Nesta escala de tempo está apresentado um gráfico de 1961 ano até 2014 ano Tunisia. Dados de 1960 ano ausente. O número de observações reais por data: 54.
Fonte (nome):
Indicadores de desenvolvimento mundial
Fonte (organização):
Carbon Dioxide Information Analysis Center, Environmental Sciences Division, Oak Ridge National Laboratory, Tennessee, United States.
Categorias:
Climate Change, Environment
Foi atualizado:
23 abr 2017 ano
Indicadores de alterações dos valores ao longo dos anos
Mínimo:
0.409
1 jan 1961 ano
Máximo:
2.623
1 jan 2011 ano
Na data de observação
Valor
Mudança absoluta
A alteração em relação ao valor anterior
1 jan 1961 ano
0.409
+0.409
0.0%
1 jan 1962 ano
0.413
+0.004
0.98%
1 jan 1963 ano
0.413
0.0
-0.06%
1 jan 1964 ano
0.439
+0.026
6.27%
1 jan 1965 ano
0.609
+0.17
38.68%
1 jan 1966 ano
0.532
-0.076
-12.55%
1 jan 1967 ano
0.61
+0.078
14.6%
1 jan 1968 ano
0.639
+0.029
4.74%
1 jan 1969 ano
0.729
+0.09
14.14%
1 jan 1970 ano
0.767
+0.038
5.15%
1 jan 1971 ano
0.73
-0.036
-4.76%
1 jan 1972 ano
0.809
+0.079
10.78%
1 jan 1973 ano
0.895
+0.086
10.62%
1 jan 1974 ano
0.896
+0.001
0.15%
1 jan 1975 ano
0.983
+0.086
9.63%
1 jan 1976 ano
0.989
+0.006
0.64%
1 jan 1977 ano
1.019
+0.03
3.01%
1 jan 1978 ano
1.147
+0.129
12.66%
1 jan 1979 ano
1.238
+0.091
7.92%
1 jan 1980 ano
1.411
+0.173
13.95%
1 jan 1981 ano
1.487
+0.076
5.38%
1 jan 1982 ano
1.5
+0.013
0.89%
1 jan 1983 ano
1.416
-0.085
-5.64%
1 jan 1984 ano
1.637
+0.221
15.64%
1 jan 1985 ano
1.64
+0.002
0.15%
1 jan 1986 ano
1.645
+0.005
0.3%
1 jan 1987 ano
1.61
-0.034
-2.09%
1 jan 1988 ano
1.529
-0.081
-5.05%
1 jan 1989 ano
1.586
+0.057
3.75%
1 jan 1990 ano
1.663
+0.077
4.83%
1 jan 1991 ano
1.627
-0.036
-2.16%
1 jan 1992 ano
1.862
+0.235
14.45%
1 jan 1993 ano
1.77
-0.093
-4.97%
1 jan 1994 ano
1.925
+0.155
8.78%
1 jan 1995 ano
1.814
-0.111
-5.75%
1 jan 1996 ano
1.757
-0.058
-3.18%
1 jan 1997 ano
1.844
+0.087
4.96%
1 jan 1998 ano
1.839
-0.005
-0.26%
1 jan 1999 ano
1.929
+0.09
4.88%
1 jan 2000 ano
1.939
+0.01
0.51%
1 jan 2001 ano
2.086
+0.147
7.58%
1 jan 2002 ano
2.157
+0.072
3.43%
1 jan 2003 ano
2.14
-0.017
-0.8%
1 jan 2004 ano
2.159
+0.019
0.9%
1 jan 2005 ano
2.245
+0.086
3.97%
1 jan 2006 ano
2.26
+0.015
0.65%
1 jan 2007 ano
2.27
+0.011
0.47%
1 jan 2008 ano
2.358
+0.088
3.87%
1 jan 2009 ano
2.404
+0.046
1.93%
1 jan 2010 ano
2.375
-0.029
-1.21%
1 jan 2011 ano
2.623
+0.248
10.45%
1 jan 2012 ano
2.438
-0.185
-7.04%
1 jan 2013 ano
2.506
+0.068
2.78%
1 jan 2014 ano
2.541
+0.036
1.43%
Classificação de países por estatísticas atuais por anos


Comentários: