29
/pt/
pt
AIzaSyAYiBZKx7MnpbEhh9jyipgxe19OcubqV5w
April 1, 2024
232015
Samoa
WSM
true
2
1
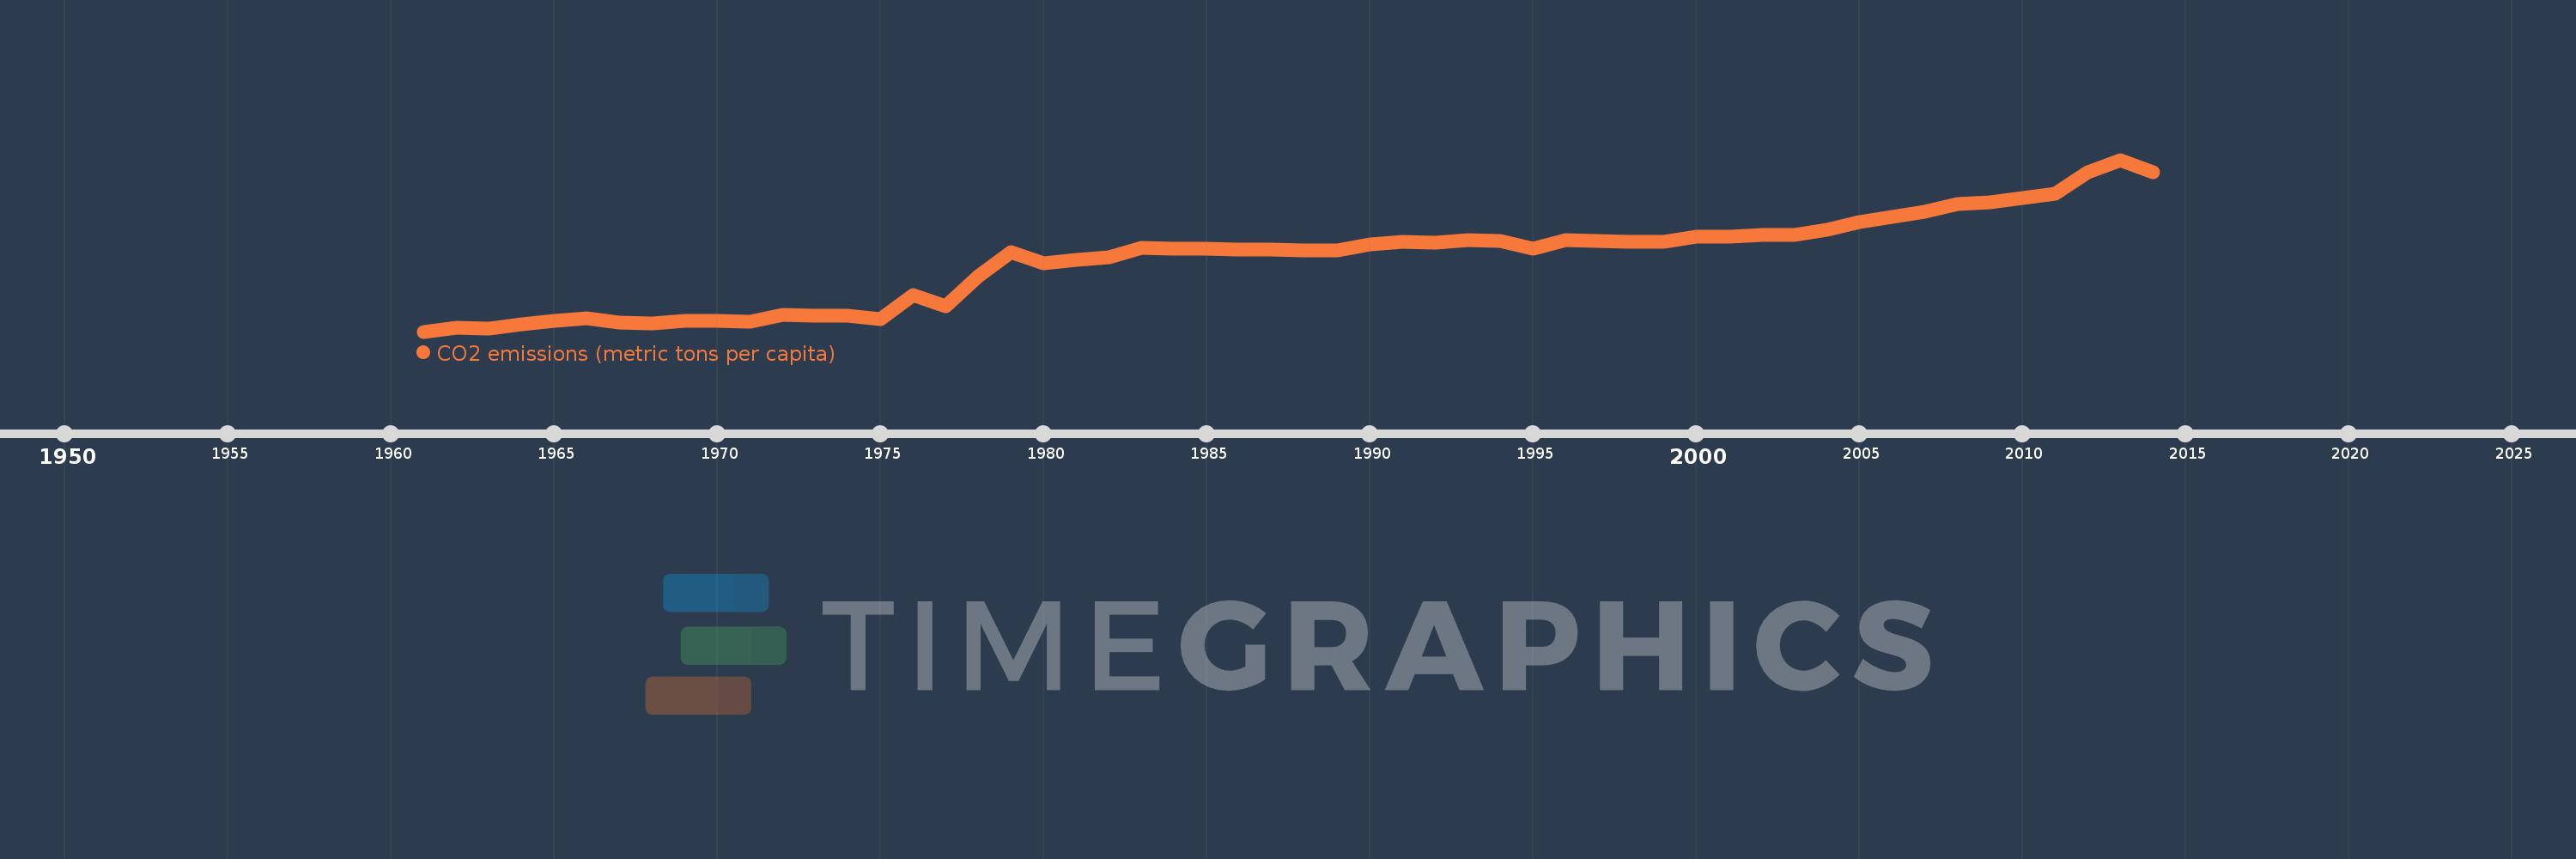
CO2 emissions (metric tons per capita)
2014,2013,2012,2011,2010,2009,2008,2007,2006,2005,2004,2003,2002,2001,2000,1999,1998,1997,1996,1995,1994,1993,1992,1991,1990,1989,1988,1987,1986,1985,1984,1983,1982,1981,1980,1979,1978,1977,1976,1975,1974,1973,1972,1971,1970,1969,1968,1967,1966,1965,1964,1963,1962,1961
Estas estatísticas em outros países:
AfghanistanAlbaniaAlgeriaAndorraAngolaAntigua and BarbudaArab WorldArgentinaArmeniaArubaAustraliaAustriaAzerbaijanBahamas, TheBahrainBangladeshBarbadosBelarusBelgiumBelizeBeninBermudaBhutanBoliviaBosnia and HerzegovinaBotswanaBrazilBritish Virgin IslandsBrunei DarussalamBulgariaBurkina FasoBurundiCabo VerdeCambodiaCameroonCanadaCaribbean small statesCayman IslandsCentral African RepublicCentral Europe and the BalticsChadChileChinaColombiaComorosCongo, Dem. Rep.Congo, Rep.Costa RicaCote d'IvoireCroatiaCubaCuracaoCyprusCzech RepublicDenmarkDjiboutiDominicaDominican RepublicEarly-demographic dividendEast Asia & PacificEast Asia & Pacific (excluding high income)East Asia & Pacific (IDA & IBRD countries)EcuadorEgypt, Arab Rep.El SalvadorEquatorial GuineaEritreaEstoniaEthiopiaEuro areaEurope & Central AsiaEurope & Central Asia (excluding high income)Europe & Central Asia (IDA & IBRD countries)European UnionFaroe IslandsFijiFinlandFragile and conflict affected situationsFranceFrench PolynesiaGabonGambia, TheGeorgiaGermanyGhanaGibraltarGreeceGreenlandGrenadaGuatemalaGuineaGuinea-BissauGuyanaHaitiHeavily indebted poor countries (HIPC)High incomeHondurasHong Kong SAR, ChinaHungaryIBRD onlyIcelandIDA & IBRD totalIDA blendIDA onlyIDA totalIndiaIndonesiaIran, Islamic Rep.IraqIrelandIsraelItalyJamaicaJapanJordanKazakhstanKenyaKiribatiKorea, Dem. People’s Rep.Korea, Rep.KuwaitKyrgyz RepublicLao PDRLate-demographic dividendLatin America & Caribbean Latin America & Caribbean (excluding high income)Latin America & the Caribbean (IDA & IBRD countries)LatviaLeast developed countries: UN classificationLebanonLesothoLiberiaLibyaLiechtensteinLithuaniaLow & middle incomeLow incomeLower middle incomeLuxembourgMacao SAR, ChinaMacedonia, FYRMadagascarMalawiMalaysiaMaldivesMaliMaltaMarshall IslandsMauritaniaMauritiusMexicoMicronesia, Fed. Sts.Middle East & North AfricaMiddle East & North Africa (excluding high income)Middle East & North Africa (IDA & IBRD countries)Middle incomeMoldovaMongoliaMontenegroMoroccoMozambiqueMyanmarNamibiaNauruNepalNetherlandsNew CaledoniaNew ZealandNicaraguaNigerNigeriaNorth AmericaNorwayOECD membersOmanOther small statesPacific island small statesPakistanPalauPanamaPapua New GuineaParaguayPeruPhilippinesPolandPortugalPost-demographic dividendPre-demographic dividendQatarRomaniaRussian FederationRwandaSamoaSao Tome and PrincipeSaudi ArabiaSenegalSerbiaSeychellesSierra LeoneSingaporeSint Maarten (Dutch part)Slovak RepublicSloveniaSmall statesSolomon IslandsSomaliaSouth AfricaSouth AsiaSouth Asia (IDA & IBRD)South SudanSpainSri LankaSt. Kitts and NevisSt. LuciaSt. Vincent and the GrenadinesSub-Saharan Africa Sub-Saharan Africa (excluding high income)Sub-Saharan Africa (IDA & IBRD countries)SudanSurinameSwazilandSwedenSwitzerlandSyrian Arab RepublicTajikistanTanzaniaThailandTimor-LesteTogoTongaTrinidad and TobagoTunisiaTurkeyTurkmenistanTurks and Caicos IslandsUgandaUkraineUnited Arab EmiratesUnited KingdomUnited StatesUpper middle incomeUruguayUzbekistanVanuatuVenezuela, RBVietnamWest Bank and GazaWorldYemen, Rep.ZambiaZimbabwe Linha do tempo:
Nesta escala de tempo está apresentado um gráfico de 1961 ano até 2014 ano Samoa. Dados de 1960 ano ausente. O número de observações reais por data: 54.
Fonte (nome):
Indicadores de desenvolvimento mundial
Fonte (organização):
Carbon Dioxide Information Analysis Center, Environmental Sciences Division, Oak Ridge National Laboratory, Tennessee, United States.
Categorias:
Climate Change, Environment
Foi atualizado:
23 abr 2017 ano
Indicadores de alterações dos valores ao longo dos anos
Mínimo:
0.135
1 jan 1961 ano
Máximo:
1.339
1 jan 2013 ano
Na data de observação
Valor
Mudança absoluta
A alteração em relação ao valor anterior
1 jan 1961 ano
0.135
+0.135
0.0%
1 jan 1962 ano
0.164
+0.029
21.12%
1 jan 1963 ano
0.158
-0.005
-3.17%
1 jan 1964 ano
0.184
+0.026
16.21%
1 jan 1965 ano
0.208
+0.024
13.08%
1 jan 1966 ano
0.231
+0.023
10.95%
1 jan 1967 ano
0.196
-0.034
-14.92%
1 jan 1968 ano
0.191
-0.005
-2.61%
1 jan 1969 ano
0.213
+0.022
11.54%
1 jan 1970 ano
0.209
-0.005
-2.15%
1 jan 1971 ano
0.205
-0.004
-1.85%
1 jan 1972 ano
0.252
+0.047
23.06%
1 jan 1973 ano
0.249
-0.003
-1.28%
1 jan 1974 ano
0.246
-0.003
-1.05%
1 jan 1975 ano
0.22
-0.027
-10.8%
1 jan 1976 ano
0.388
+0.168
76.41%
1 jan 1977 ano
0.313
-0.075
-19.29%
1 jan 1978 ano
0.526
+0.214
68.29%
1 jan 1979 ano
0.69
+0.164
31.16%
1 jan 1980 ano
0.616
-0.074
-10.78%
1 jan 1981 ano
0.636
+0.02
3.32%
1 jan 1982 ano
0.656
+0.02
3.12%
1 jan 1983 ano
0.722
+0.066
10.03%
1 jan 1984 ano
0.718
-0.004
-0.62%
1 jan 1985 ano
0.714
-0.004
-0.56%
1 jan 1986 ano
0.71
-0.003
-0.47%
1 jan 1987 ano
0.708
-0.002
-0.35%
1 jan 1988 ano
0.706
-0.002
-0.26%
1 jan 1989 ano
0.704
-0.002
-0.25%
1 jan 1990 ano
0.747
+0.043
6.07%
1 jan 1991 ano
0.766
+0.019
2.48%
1 jan 1992 ano
0.76
-0.006
-0.74%
1 jan 1993 ano
0.775
+0.015
2.01%
1 jan 1994 ano
0.768
-0.008
-0.98%
1 jan 1995 ano
0.717
-0.051
-6.6%
1 jan 1996 ano
0.776
+0.059
8.21%
1 jan 1997 ano
0.771
-0.005
-0.65%
1 jan 1998 ano
0.767
-0.004
-0.53%
1 jan 1999 ano
0.763
-0.003
-0.46%
1 jan 2000 ano
0.802
+0.039
5.08%
1 jan 2001 ano
0.798
-0.004
-0.49%
1 jan 2002 ano
0.815
+0.017
2.07%
1 jan 2003 ano
0.81
-0.005
-0.58%
1 jan 2004 ano
0.846
+0.036
4.49%
1 jan 2005 ano
0.902
+0.056
6.65%
1 jan 2006 ano
0.937
+0.035
3.89%
1 jan 2007 ano
0.972
+0.035
3.69%
1 jan 2008 ano
1.026
+0.054
5.57%
1 jan 2009 ano
1.039
+0.013
1.29%
1 jan 2010 ano
1.072
+0.033
3.14%
1 jan 2011 ano
1.104
+0.032
2.96%
1 jan 2012 ano
1.252
+0.148
13.43%
1 jan 2013 ano
1.339
+0.087
6.98%
1 jan 2014 ano
1.252
-0.088
-6.53%
Classificação de países por estatísticas atuais por anos


Comentários: