29
/pt/
pt
AIzaSyAYiBZKx7MnpbEhh9jyipgxe19OcubqV5w
April 1, 2024
87497
Bolivia
BOL
true
2
1
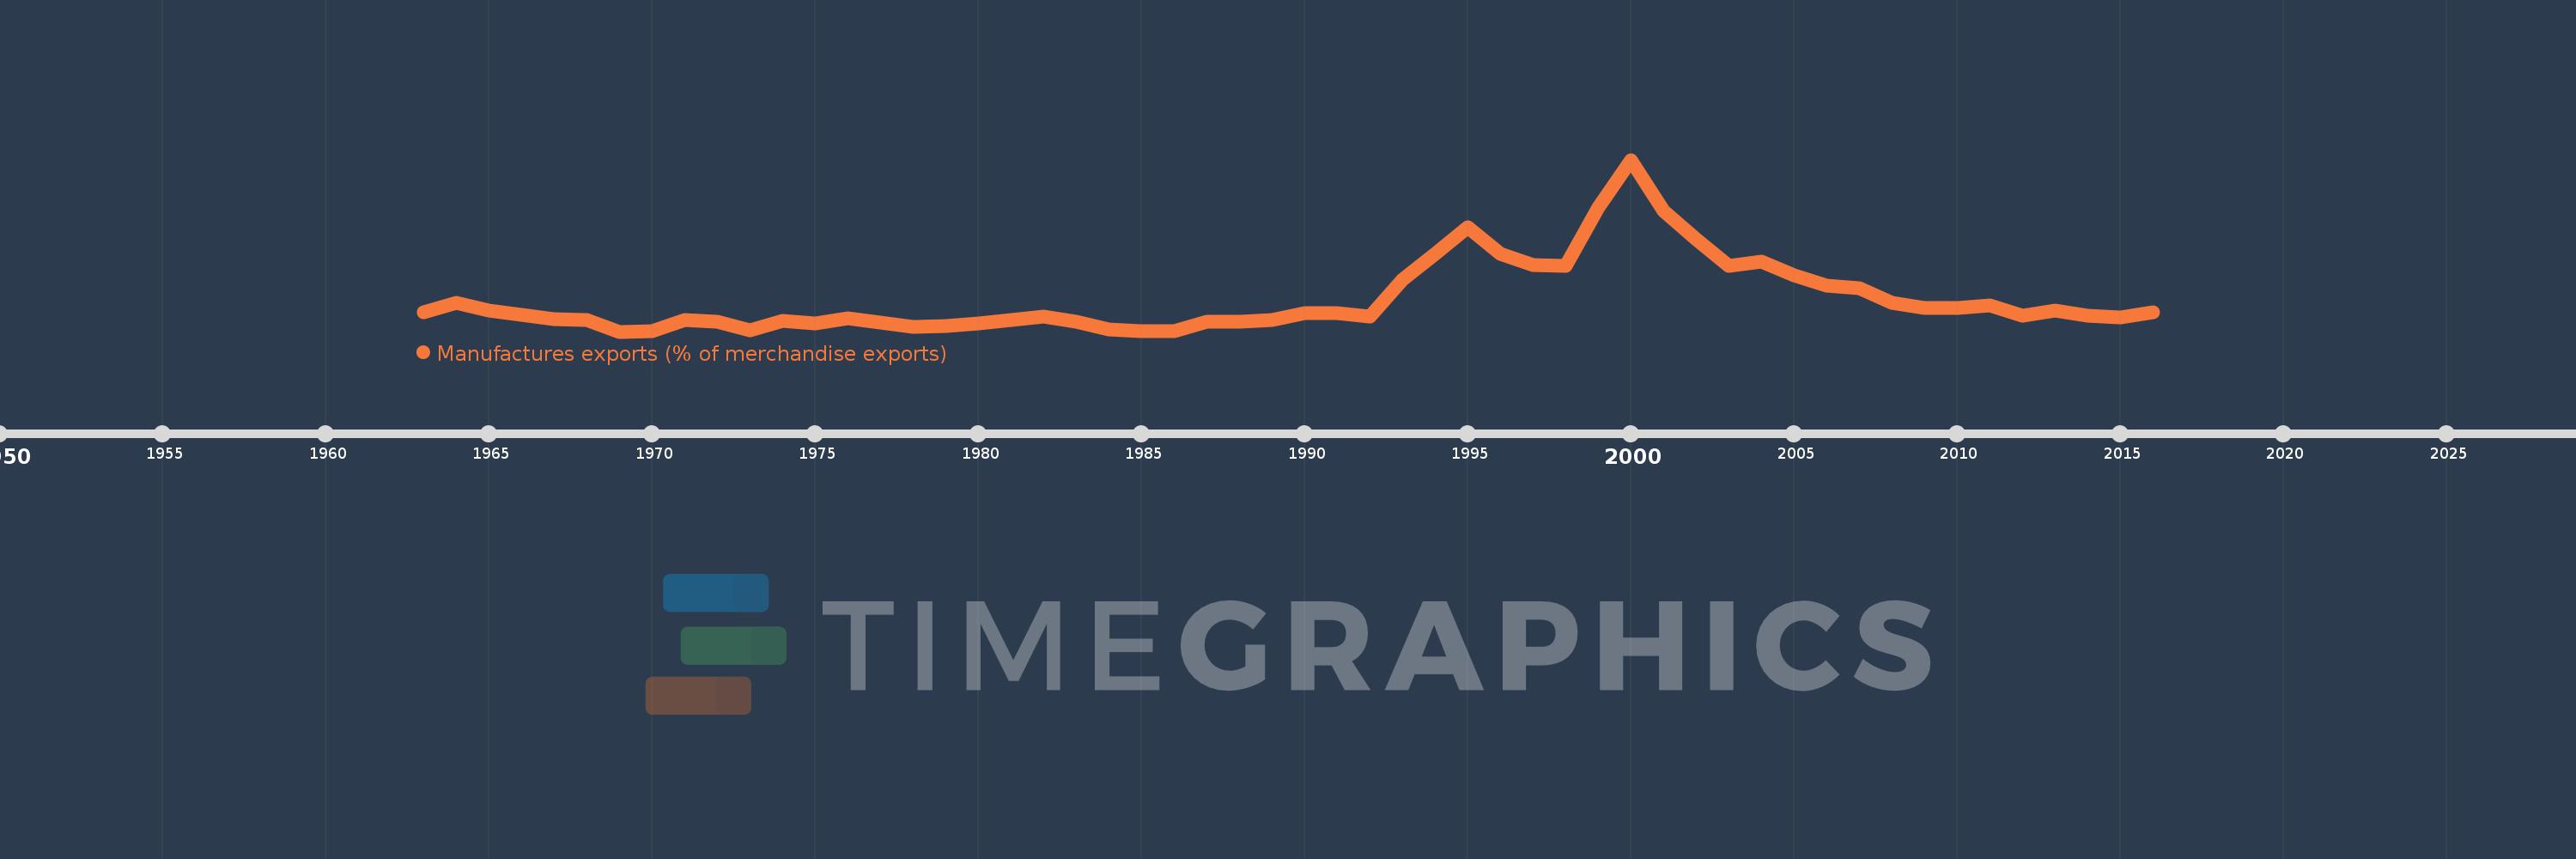
Manufactures exports (% of merchandise exports)
2016,2015,2014,2013,2012,2011,2010,2009,2008,2007,2006,2005,2004,2003,2002,2001,2000,1999,1998,1997,1996,1995,1994,1993,1992,1991,1990,1989,1988,1987,1986,1985,1984,1983,1982,1981,1980,1979,1978,1977,1976,1975,1974,1973,1972,1971,1970,1969,1968,1967,1966,1965,1964,1963
Estas estatísticas em outros países:
AfghanistanAlbaniaAlgeriaAndorraAngolaAntigua and BarbudaArab WorldArgentinaArmeniaArubaAustraliaAustriaAzerbaijanBahamas, TheBahrainBangladeshBarbadosBelarusBelgiumBelizeBeninBermudaBhutanBoliviaBosnia and HerzegovinaBotswanaBrazilBrunei DarussalamBulgariaBurkina FasoBurundiCabo VerdeCambodiaCameroonCanadaCaribbean small statesCayman IslandsCentral African RepublicCentral Europe and the BalticsChadChileChinaColombiaComorosCongo, Dem. Rep.Congo, Rep.Costa RicaCote d'IvoireCroatiaCubaCyprusCzech RepublicDenmarkDjiboutiDominicaDominican RepublicEarly-demographic dividendEast Asia & PacificEast Asia & Pacific (excluding high income)East Asia & Pacific (IDA & IBRD countries)EcuadorEgypt, Arab Rep.El SalvadorEquatorial GuineaEritreaEstoniaEthiopiaEuro areaEurope & Central AsiaEurope & Central Asia (excluding high income)Europe & Central Asia (IDA & IBRD countries)European UnionFaroe IslandsFijiFinlandFragile and conflict affected situationsFranceFrench PolynesiaGabonGambia, TheGeorgiaGermanyGhanaGreeceGreenlandGrenadaGuatemalaGuineaGuinea-BissauGuyanaHaitiHeavily indebted poor countries (HIPC)High incomeHondurasHong Kong SAR, ChinaHungaryIBRD onlyIcelandIDA & IBRD totalIDA blendIDA onlyIDA totalIndiaIndonesiaIran, Islamic Rep.IraqIrelandIsraelItalyJamaicaJapanJordanKazakhstanKenyaKiribatiKorea, Rep.KuwaitKyrgyz RepublicLao PDRLate-demographic dividendLatin America & Caribbean Latin America & Caribbean (excluding high income)Latin America & the Caribbean (IDA & IBRD countries)LatviaLeast developed countries: UN classificationLebanonLesothoLiberiaLibyaLithuaniaLow & middle incomeLower middle incomeLuxembourgMacao SAR, ChinaMacedonia, FYRMadagascarMalawiMalaysiaMaldivesMaliMaltaMauritaniaMauritiusMexicoMiddle East & North AfricaMiddle East & North Africa (excluding high income)Middle East & North Africa (IDA & IBRD countries)Middle incomeMoldovaMongoliaMoroccoMozambiqueMyanmarNamibiaNepalNetherlandsNew CaledoniaNew ZealandNicaraguaNigerNigeriaNorth AmericaNorwayOECD membersOmanOther small statesPacific island small statesPakistanPalauPanamaPapua New GuineaParaguayPeruPhilippinesPolandPortugalPost-demographic dividendPre-demographic dividendQatarRomaniaRussian FederationRwandaSamoaSao Tome and PrincipeSaudi ArabiaSenegalSerbiaSeychellesSierra LeoneSingaporeSlovak RepublicSloveniaSmall statesSolomon IslandsSomaliaSouth AfricaSouth AsiaSouth Asia (IDA & IBRD)SpainSri LankaSt. Kitts and NevisSt. LuciaSt. Vincent and the GrenadinesSub-Saharan Africa Sub-Saharan Africa (excluding high income)Sub-Saharan Africa (IDA & IBRD countries)SudanSurinameSwazilandSwedenSwitzerlandSyrian Arab RepublicTajikistanTanzaniaThailandTimor-LesteTogoTongaTrinidad and TobagoTunisiaTurkeyTurkmenistanTurks and Caicos IslandsTuvaluUgandaUkraineUnited Arab EmiratesUnited KingdomUnited StatesUpper middle incomeUruguayVanuatuVenezuela, RBVietnamVirgin Islands (U.S.)WorldYemen, Rep.ZambiaZimbabwe Linha do tempo:
Nesta escala de tempo está apresentado um gráfico de 1963 ano até 2016 ano Bolivia. Dados de 1962 ano ausente. O número de observações reais por data: 54.
Fonte (nome):
Indicadores de desenvolvimento mundial
Fonte (organização):
World Bank staff estimates from the Comtrade database maintained by the United Nations Statistics Division.
Categorias:
Private Sector, Trade
Foi atualizado:
23 abr 2017 ano
Indicadores de alterações dos valores ao longo dos anos
Mínimo:
0.31
1 jan 1969 ano
Máximo:
40.827
1 jan 2000 ano
Na data de observação
Valor
Mudança absoluta
A alteração em relação ao valor anterior
1 jan 1963 ano
4.95
+4.95
0.0%
1 jan 1964 ano
7.08
+2.13
43.03%
1 jan 1965 ano
5.309
-1.771
-25.01%
1 jan 1966 ano
4.297
-1.012
-19.06%
1 jan 1967 ano
3.157
-1.14
-26.53%
1 jan 1968 ano
2.99
-0.167
-5.3%
1 jan 1969 ano
0.31
-2.68
-89.64%
1 jan 1970 ano
0.436
+0.126
40.64%
1 jan 1971 ano
3.02
+2.585
593.24%
1 jan 1972 ano
2.583
-0.437
-14.47%
1 jan 1973 ano
0.572
-2.012
-77.86%
1 jan 1974 ano
2.815
+2.243
392.27%
1 jan 1975 ano
2.182
-0.633
-22.47%
1 jan 1976 ano
3.456
+1.273
58.34%
1 jan 1977 ano
2.41
-1.046
-30.27%
1 jan 1978 ano
1.442
-0.967
-40.15%
1 jan 1979 ano
1.61
+0.167
11.61%
1 jan 1980 ano
2.189
+0.579
35.98%
1 jan 1981 ano
2.946
+0.757
34.58%
1 jan 1982 ano
3.806
+0.86
29.18%
1 jan 1983 ano
2.636
-1.17
-30.74%
1 jan 1984 ano
0.84
-1.796
-68.13%
1 jan 1985 ano
0.398
-0.442
-52.59%
1 jan 1986 ano
0.377
-0.021
-5.39%
1 jan 1987 ano
2.703
+2.326
617.29%
1 jan 1988 ano
2.68
-0.023
-0.86%
1 jan 1989 ano
3.034
+0.354
13.21%
1 jan 1990 ano
4.681
+1.647
54.31%
1 jan 1991 ano
4.7
+0.019
0.4%
1 jan 1992 ano
3.82
-0.88
-18.73%
1 jan 1993 ano
12.484
+8.664
226.84%
1 jan 1994 ano
18.685
+6.202
49.68%
1 jan 1995 ano
24.886
+6.201
33.18%
1 jan 1996 ano
18.562
-6.324
-25.41%
1 jan 1997 ano
16.008
-2.555
-13.76%
1 jan 1998 ano
15.899
-0.109
-0.68%
1 jan 1999 ano
29.679
+13.78
86.67%
1 jan 2000 ano
40.827
+11.148
37.56%
1 jan 2001 ano
28.852
-11.974
-29.33%
1 jan 2002 ano
22.129
-6.723
-23.3%
1 jan 2003 ano
15.808
-6.321
-28.56%
1 jan 2004 ano
16.826
+1.018
6.44%
1 jan 2005 ano
13.605
-3.221
-19.14%
1 jan 2006 ano
11.223
-2.382
-17.51%
1 jan 2007 ano
10.564
-0.659
-5.87%
1 jan 2008 ano
7.023
-3.541
-33.52%
1 jan 2009 ano
5.821
-1.203
-17.13%
1 jan 2010 ano
5.797
-0.023
-0.4%
1 jan 2011 ano
6.425
+0.627
10.82%
1 jan 2012 ano
4.092
-2.333
-36.31%
1 jan 2013 ano
5.339
+1.247
30.48%
1 jan 2014 ano
4.006
-1.333
-24.97%
1 jan 2015 ano
3.571
-0.435
-10.86%
1 jan 2016 ano
4.825
+1.254
35.12%
Classificação de países por estatísticas atuais por anos


Comentários: