29
/pt/
pt
AIzaSyAYiBZKx7MnpbEhh9jyipgxe19OcubqV5w
April 1, 2024
74139
Austria
AUT
true
2
1
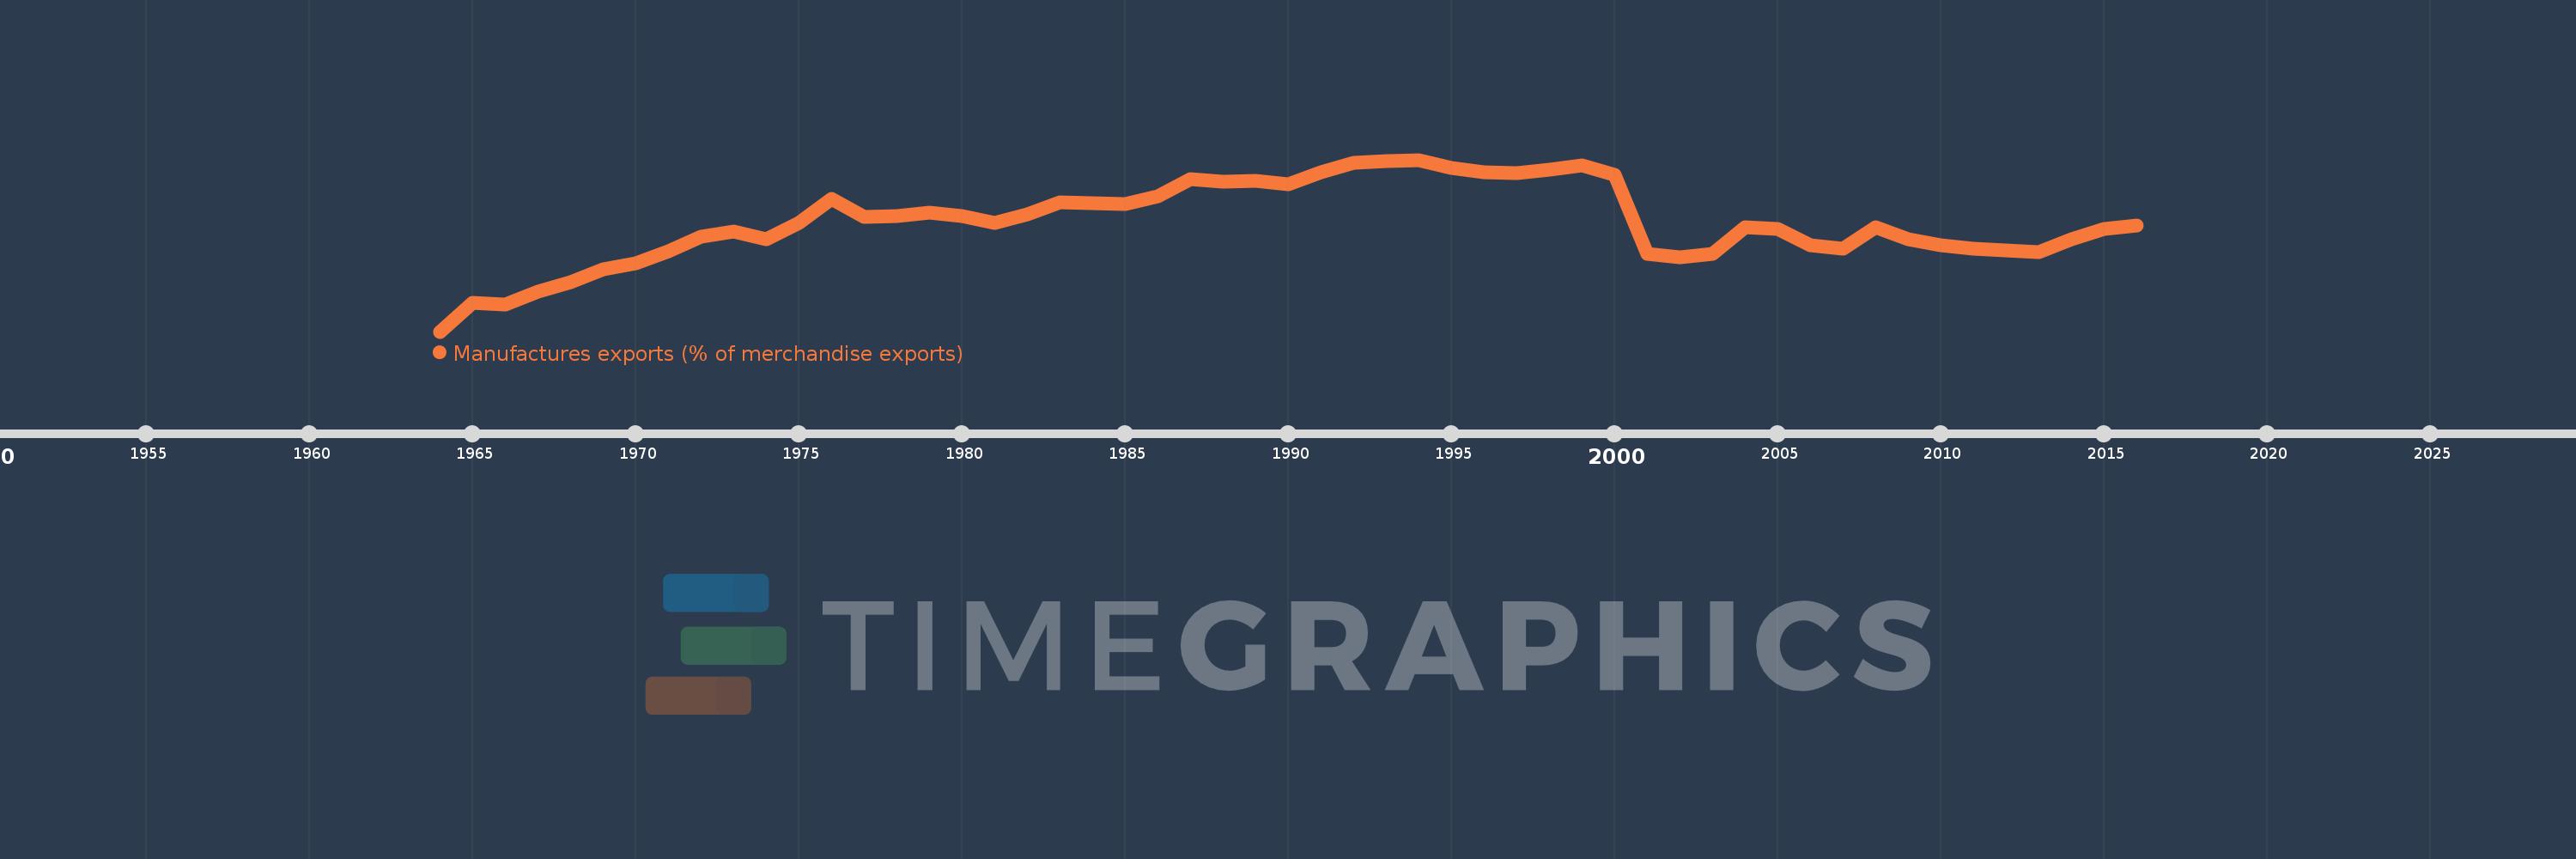
Manufactures exports (% of merchandise exports)
2016,2015,2014,2013,2012,2011,2010,2009,2008,2007,2006,2005,2004,2003,2002,2001,2000,1999,1998,1997,1996,1995,1994,1993,1992,1991,1990,1989,1988,1987,1986,1985,1984,1983,1982,1981,1980,1979,1978,1977,1976,1975,1974,1973,1972,1971,1970,1969,1968,1967,1966,1965,1964
Estas estatísticas em outros países:
AfghanistanAlbaniaAlgeriaAndorraAngolaAntigua and BarbudaArab WorldArgentinaArmeniaArubaAustraliaAustriaAzerbaijanBahamas, TheBahrainBangladeshBarbadosBelarusBelgiumBelizeBeninBermudaBhutanBoliviaBosnia and HerzegovinaBotswanaBrazilBrunei DarussalamBulgariaBurkina FasoBurundiCabo VerdeCambodiaCameroonCanadaCaribbean small statesCayman IslandsCentral African RepublicCentral Europe and the BalticsChadChileChinaColombiaComorosCongo, Dem. Rep.Congo, Rep.Costa RicaCote d'IvoireCroatiaCubaCyprusCzech RepublicDenmarkDjiboutiDominicaDominican RepublicEarly-demographic dividendEast Asia & PacificEast Asia & Pacific (excluding high income)East Asia & Pacific (IDA & IBRD countries)EcuadorEgypt, Arab Rep.El SalvadorEquatorial GuineaEritreaEstoniaEthiopiaEuro areaEurope & Central AsiaEurope & Central Asia (excluding high income)Europe & Central Asia (IDA & IBRD countries)European UnionFaroe IslandsFijiFinlandFragile and conflict affected situationsFranceFrench PolynesiaGabonGambia, TheGeorgiaGermanyGhanaGreeceGreenlandGrenadaGuatemalaGuineaGuinea-BissauGuyanaHaitiHeavily indebted poor countries (HIPC)High incomeHondurasHong Kong SAR, ChinaHungaryIBRD onlyIcelandIDA & IBRD totalIDA blendIDA onlyIDA totalIndiaIndonesiaIran, Islamic Rep.IraqIrelandIsraelItalyJamaicaJapanJordanKazakhstanKenyaKiribatiKorea, Rep.KuwaitKyrgyz RepublicLao PDRLate-demographic dividendLatin America & Caribbean Latin America & Caribbean (excluding high income)Latin America & the Caribbean (IDA & IBRD countries)LatviaLeast developed countries: UN classificationLebanonLesothoLiberiaLibyaLithuaniaLow & middle incomeLower middle incomeLuxembourgMacao SAR, ChinaMacedonia, FYRMadagascarMalawiMalaysiaMaldivesMaliMaltaMauritaniaMauritiusMexicoMiddle East & North AfricaMiddle East & North Africa (excluding high income)Middle East & North Africa (IDA & IBRD countries)Middle incomeMoldovaMongoliaMoroccoMozambiqueMyanmarNamibiaNepalNetherlandsNew CaledoniaNew ZealandNicaraguaNigerNigeriaNorth AmericaNorwayOECD membersOmanOther small statesPacific island small statesPakistanPalauPanamaPapua New GuineaParaguayPeruPhilippinesPolandPortugalPost-demographic dividendPre-demographic dividendQatarRomaniaRussian FederationRwandaSamoaSao Tome and PrincipeSaudi ArabiaSenegalSerbiaSeychellesSierra LeoneSingaporeSlovak RepublicSloveniaSmall statesSolomon IslandsSomaliaSouth AfricaSouth AsiaSouth Asia (IDA & IBRD)SpainSri LankaSt. Kitts and NevisSt. LuciaSt. Vincent and the GrenadinesSub-Saharan Africa Sub-Saharan Africa (excluding high income)Sub-Saharan Africa (IDA & IBRD countries)SudanSurinameSwazilandSwedenSwitzerlandSyrian Arab RepublicTajikistanTanzaniaThailandTimor-LesteTogoTongaTrinidad and TobagoTunisiaTurkeyTurkmenistanTurks and Caicos IslandsTuvaluUgandaUkraineUnited Arab EmiratesUnited KingdomUnited StatesUpper middle incomeUruguayVanuatuVenezuela, RBVietnamVirgin Islands (U.S.)WorldYemen, Rep.ZambiaZimbabwe Linha do tempo:
Nesta escala de tempo está apresentado um gráfico de 1964 ano até 2016 ano Austria. Dados de 1963 ano ausente. O número de observações reais por data: 53.
Fonte (nome):
Indicadores de desenvolvimento mundial
Fonte (organização):
World Bank staff estimates from the Comtrade database maintained by the United Nations Statistics Division.
Categorias:
Private Sector, Trade
Foi atualizado:
23 abr 2017 ano
Indicadores de alterações dos valores ao longo dos anos
Mínimo:
72.186
1 jan 1964 ano
Máximo:
88.93
1 jan 1994 ano
Na data de observação
Valor
Mudança absoluta
A alteração em relação ao valor anterior
1 jan 1964 ano
72.186
+72.186
0.0%
1 jan 1965 ano
75.0
+2.815
3.9%
1 jan 1966 ano
74.782
-0.219
-0.29%
1 jan 1967 ano
76.044
+1.263
1.69%
1 jan 1968 ano
77.014
+0.97
1.28%
1 jan 1969 ano
78.294
+1.279
1.66%
1 jan 1970 ano
78.847
+0.553
0.71%
1 jan 1971 ano
80.042
+1.195
1.51%
1 jan 1972 ano
81.439
+1.398
1.75%
1 jan 1973 ano
81.934
+0.494
0.61%
1 jan 1974 ano
81.213
-0.721
-0.88%
1 jan 1975 ano
82.742
+1.529
1.88%
1 jan 1976 ano
85.112
+2.37
2.86%
1 jan 1977 ano
83.327
-1.786
-2.1%
1 jan 1978 ano
83.447
+0.121
0.15%
1 jan 1979 ano
83.74
+0.292
0.35%
1 jan 1980 ano
83.451
-0.289
-0.34%
1 jan 1981 ano
82.759
-0.692
-0.83%
1 jan 1982 ano
83.601
+0.842
1.02%
1 jan 1983 ano
84.785
+1.184
1.42%
1 jan 1984 ano
84.698
-0.087
-0.1%
1 jan 1985 ano
84.589
-0.109
-0.13%
1 jan 1986 ano
85.393
+0.804
0.95%
1 jan 1987 ano
87.084
+1.69
1.98%
1 jan 1988 ano
86.787
-0.297
-0.34%
1 jan 1989 ano
86.894
+0.107
0.12%
1 jan 1990 ano
86.56
-0.333
-0.38%
1 jan 1991 ano
87.696
+1.136
1.31%
1 jan 1992 ano
88.662
+0.966
1.1%
1 jan 1993 ano
88.787
+0.125
0.14%
1 jan 1994 ano
88.93
+0.144
0.16%
1 jan 1995 ano
88.114
-0.816
-0.92%
1 jan 1996 ano
87.757
-0.357
-0.41%
1 jan 1997 ano
87.673
-0.084
-0.1%
1 jan 1998 ano
87.934
+0.261
0.3%
1 jan 1999 ano
88.351
+0.417
0.47%
1 jan 2000 ano
87.489
-0.862
-0.98%
1 jan 2001 ano
79.792
-7.697
-8.8%
1 jan 2002 ano
79.387
-0.406
-0.51%
1 jan 2003 ano
79.798
+0.412
0.52%
1 jan 2004 ano
82.324
+2.526
3.17%
1 jan 2005 ano
82.226
-0.098
-0.12%
1 jan 2006 ano
80.587
-1.639
-1.99%
1 jan 2007 ano
80.236
-0.351
-0.44%
1 jan 2008 ano
82.369
+2.133
2.66%
1 jan 2009 ano
81.203
-1.167
-1.42%
1 jan 2010 ano
80.56
-0.643
-0.79%
1 jan 2011 ano
80.289
-0.271
-0.34%
1 jan 2012 ano
80.058
-0.231
-0.29%
1 jan 2013 ano
79.931
-0.127
-0.16%
1 jan 2014 ano
81.208
+1.277
1.6%
1 jan 2015 ano
82.216
+1.008
1.24%
1 jan 2016 ano
82.533
+0.317
0.39%
Classificação de países por estatísticas atuais por anos


Comentários: