29
/pt/
pt
AIzaSyAYiBZKx7MnpbEhh9jyipgxe19OcubqV5w
April 1, 2024
57264
South Asia
SAS
false
2
1
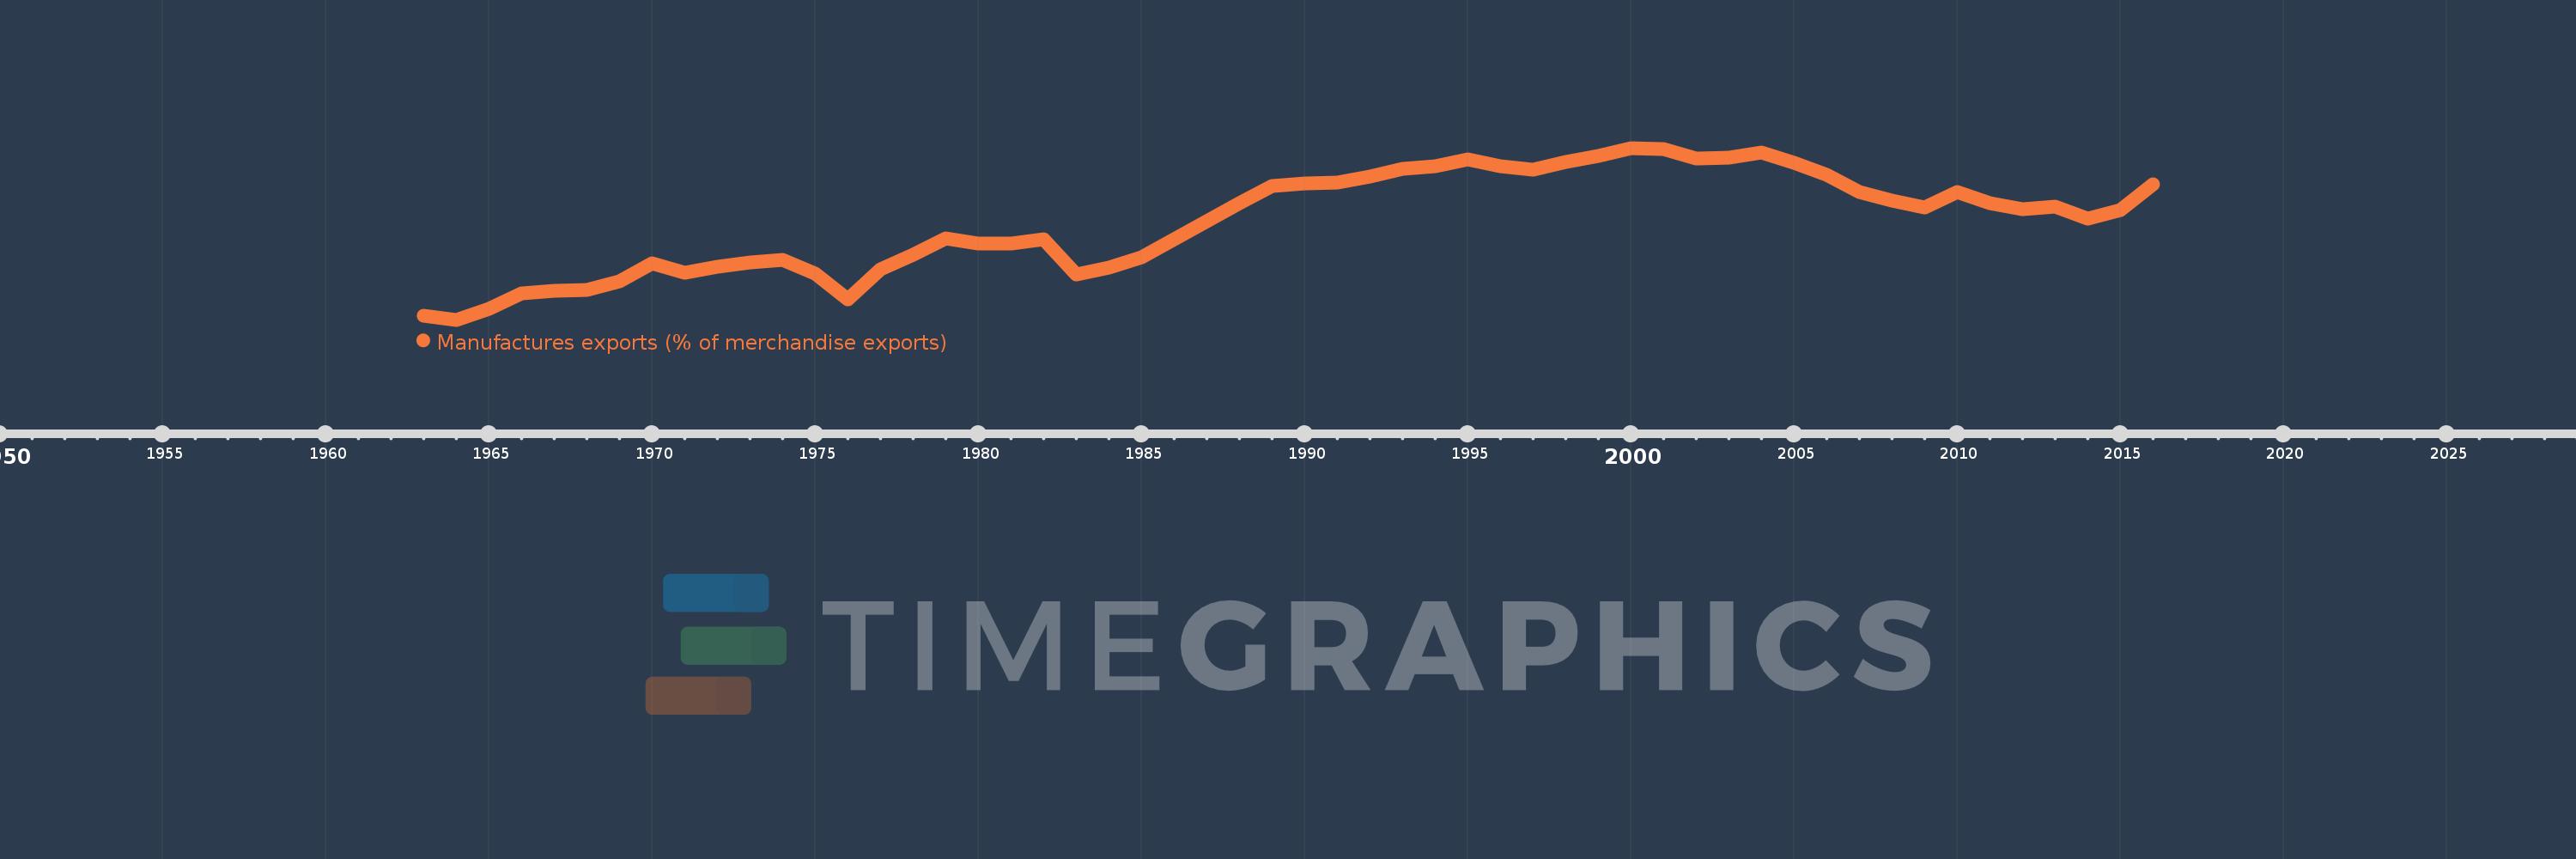
Manufactures exports (% of merchandise exports)
2016,2015,2014,2013,2012,2011,2010,2009,2008,2007,2006,2005,2004,2003,2002,2001,2000,1999,1998,1997,1996,1995,1994,1993,1992,1991,1990,1989,1988,1987,1986,1985,1984,1983,1982,1981,1980,1979,1978,1977,1976,1975,1974,1973,1972,1971,1970,1969,1968,1967,1966,1965,1964,1963
Estas estatísticas em outros países:
AfghanistanAlbaniaAlgeriaAndorraAngolaAntigua and BarbudaArab WorldArgentinaArmeniaArubaAustraliaAustriaAzerbaijanBahamas, TheBahrainBangladeshBarbadosBelarusBelgiumBelizeBeninBermudaBhutanBoliviaBosnia and HerzegovinaBotswanaBrazilBrunei DarussalamBulgariaBurkina FasoBurundiCabo VerdeCambodiaCameroonCanadaCaribbean small statesCayman IslandsCentral African RepublicCentral Europe and the BalticsChadChileChinaColombiaComorosCongo, Dem. Rep.Congo, Rep.Costa RicaCote d'IvoireCroatiaCubaCyprusCzech RepublicDenmarkDjiboutiDominicaDominican RepublicEarly-demographic dividendEast Asia & PacificEast Asia & Pacific (excluding high income)East Asia & Pacific (IDA & IBRD countries)EcuadorEgypt, Arab Rep.El SalvadorEquatorial GuineaEritreaEstoniaEthiopiaEuro areaEurope & Central AsiaEurope & Central Asia (excluding high income)Europe & Central Asia (IDA & IBRD countries)European UnionFaroe IslandsFijiFinlandFragile and conflict affected situationsFranceFrench PolynesiaGabonGambia, TheGeorgiaGermanyGhanaGreeceGreenlandGrenadaGuatemalaGuineaGuinea-BissauGuyanaHaitiHeavily indebted poor countries (HIPC)High incomeHondurasHong Kong SAR, ChinaHungaryIBRD onlyIcelandIDA & IBRD totalIDA blendIDA onlyIDA totalIndiaIndonesiaIran, Islamic Rep.IraqIrelandIsraelItalyJamaicaJapanJordanKazakhstanKenyaKiribatiKorea, Rep.KuwaitKyrgyz RepublicLao PDRLate-demographic dividendLatin America & Caribbean Latin America & Caribbean (excluding high income)Latin America & the Caribbean (IDA & IBRD countries)LatviaLeast developed countries: UN classificationLebanonLesothoLiberiaLibyaLithuaniaLow & middle incomeLower middle incomeLuxembourgMacao SAR, ChinaMacedonia, FYRMadagascarMalawiMalaysiaMaldivesMaliMaltaMauritaniaMauritiusMexicoMiddle East & North AfricaMiddle East & North Africa (excluding high income)Middle East & North Africa (IDA & IBRD countries)Middle incomeMoldovaMongoliaMoroccoMozambiqueMyanmarNamibiaNepalNetherlandsNew CaledoniaNew ZealandNicaraguaNigerNigeriaNorth AmericaNorwayOECD membersOmanOther small statesPacific island small statesPakistanPalauPanamaPapua New GuineaParaguayPeruPhilippinesPolandPortugalPost-demographic dividendPre-demographic dividendQatarRomaniaRussian FederationRwandaSamoaSao Tome and PrincipeSaudi ArabiaSenegalSerbiaSeychellesSierra LeoneSingaporeSlovak RepublicSloveniaSmall statesSolomon IslandsSomaliaSouth AfricaSouth AsiaSouth Asia (IDA & IBRD)SpainSri LankaSt. Kitts and NevisSt. LuciaSt. Vincent and the GrenadinesSub-Saharan Africa Sub-Saharan Africa (excluding high income)Sub-Saharan Africa (IDA & IBRD countries)SudanSurinameSwazilandSwedenSwitzerlandSyrian Arab RepublicTajikistanTanzaniaThailandTimor-LesteTogoTongaTrinidad and TobagoTunisiaTurkeyTurkmenistanTurks and Caicos IslandsTuvaluUgandaUkraineUnited Arab EmiratesUnited KingdomUnited StatesUpper middle incomeUruguayVanuatuVenezuela, RBVietnamVirgin Islands (U.S.)WorldYemen, Rep.ZambiaZimbabwe Linha do tempo:
Nesta escala de tempo está apresentado um gráfico de 1963 ano até 2016 ano South Asia. Dados de 1962 ano ausente. O número de observações reais por data: 54.
Fonte (nome):
Indicadores de desenvolvimento mundial
Fonte (organização):
World Bank staff estimates from the Comtrade database maintained by the United Nations Statistics Division.
Categorias:
Private Sector, Trade
Foi atualizado:
23 abr 2017 ano
Indicadores de alterações dos valores ao longo dos anos
Mínimo:
39.532
1 jan 1964 ano
Máximo:
79.35
1 jan 2000 ano
Na data de observação
Valor
Mudança absoluta
A alteração em relação ao valor anterior
1 jan 1963 ano
40.383
+40.383
0.0%
1 jan 1964 ano
39.532
-0.85
-2.11%
1 jan 1965 ano
42.15
+2.618
6.62%
1 jan 1966 ano
45.573
+3.423
8.12%
1 jan 1967 ano
46.337
+0.764
1.68%
1 jan 1968 ano
46.462
+0.125
0.27%
1 jan 1969 ano
48.436
+1.974
4.25%
1 jan 1970 ano
52.686
+4.25
8.77%
1 jan 1971 ano
50.397
-2.289
-4.34%
1 jan 1972 ano
51.762
+1.365
2.71%
1 jan 1973 ano
52.895
+1.133
2.19%
1 jan 1974 ano
53.48
+0.584
1.1%
1 jan 1975 ano
50.304
-3.176
-5.94%
1 jan 1976 ano
44.199
-6.104
-12.13%
1 jan 1977 ano
51.148
+6.949
15.72%
1 jan 1978 ano
54.512
+3.364
6.58%
1 jan 1979 ano
58.313
+3.8
6.97%
1 jan 1980 ano
57.161
-1.151
-1.97%
1 jan 1981 ano
57.122
-0.039
-0.07%
1 jan 1982 ano
58.19
+1.068
1.87%
1 jan 1983 ano
49.958
-8.232
-14.15%
1 jan 1984 ano
51.619
+1.661
3.32%
1 jan 1985 ano
53.921
+2.302
4.46%
1 jan 1986 ano
58.143
+4.222
7.83%
1 jan 1987 ano
62.348
+4.205
7.23%
1 jan 1988 ano
66.591
+4.243
6.81%
1 jan 1989 ano
70.571
+3.98
5.98%
1 jan 1990 ano
71.043
+0.473
0.67%
1 jan 1991 ano
71.29
+0.246
0.35%
1 jan 1992 ano
72.729
+1.439
2.02%
1 jan 1993 ano
74.455
+1.727
2.37%
1 jan 1994 ano
75.193
+0.737
0.99%
1 jan 1995 ano
76.628
+1.435
1.91%
1 jan 1996 ano
75.127
-1.501
-1.96%
1 jan 1997 ano
74.372
-0.755
-1.0%
1 jan 1998 ano
76.18
+1.808
2.43%
1 jan 1999 ano
77.593
+1.413
1.85%
1 jan 2000 ano
79.35
+1.757
2.26%
1 jan 2001 ano
79.148
-0.203
-0.26%
1 jan 2002 ano
76.803
-2.345
-2.96%
1 jan 2003 ano
77.042
+0.239
0.31%
1 jan 2004 ano
78.39
+1.348
1.75%
1 jan 2005 ano
75.814
-2.576
-3.29%
1 jan 2006 ano
73.17
-2.644
-3.49%
1 jan 2007 ano
69.211
-3.959
-5.41%
1 jan 2008 ano
67.076
-2.135
-3.08%
1 jan 2009 ano
65.538
-1.538
-2.29%
1 jan 2010 ano
69.234
+3.696
5.64%
1 jan 2011 ano
66.508
-2.727
-3.94%
1 jan 2012 ano
65.208
-1.3
-1.95%
1 jan 2013 ano
65.674
+0.466
0.72%
1 jan 2014 ano
63.054
-2.62
-3.99%
1 jan 2015 ano
64.916
+1.863
2.95%
1 jan 2016 ano
70.877
+5.961
9.18%
Classificação de países por estatísticas atuais por anos


Comentários: