29
/pt/
pt
AIzaSyAYiBZKx7MnpbEhh9jyipgxe19OcubqV5w
April 1, 2024
218610
Panama
PAN
true
2
1
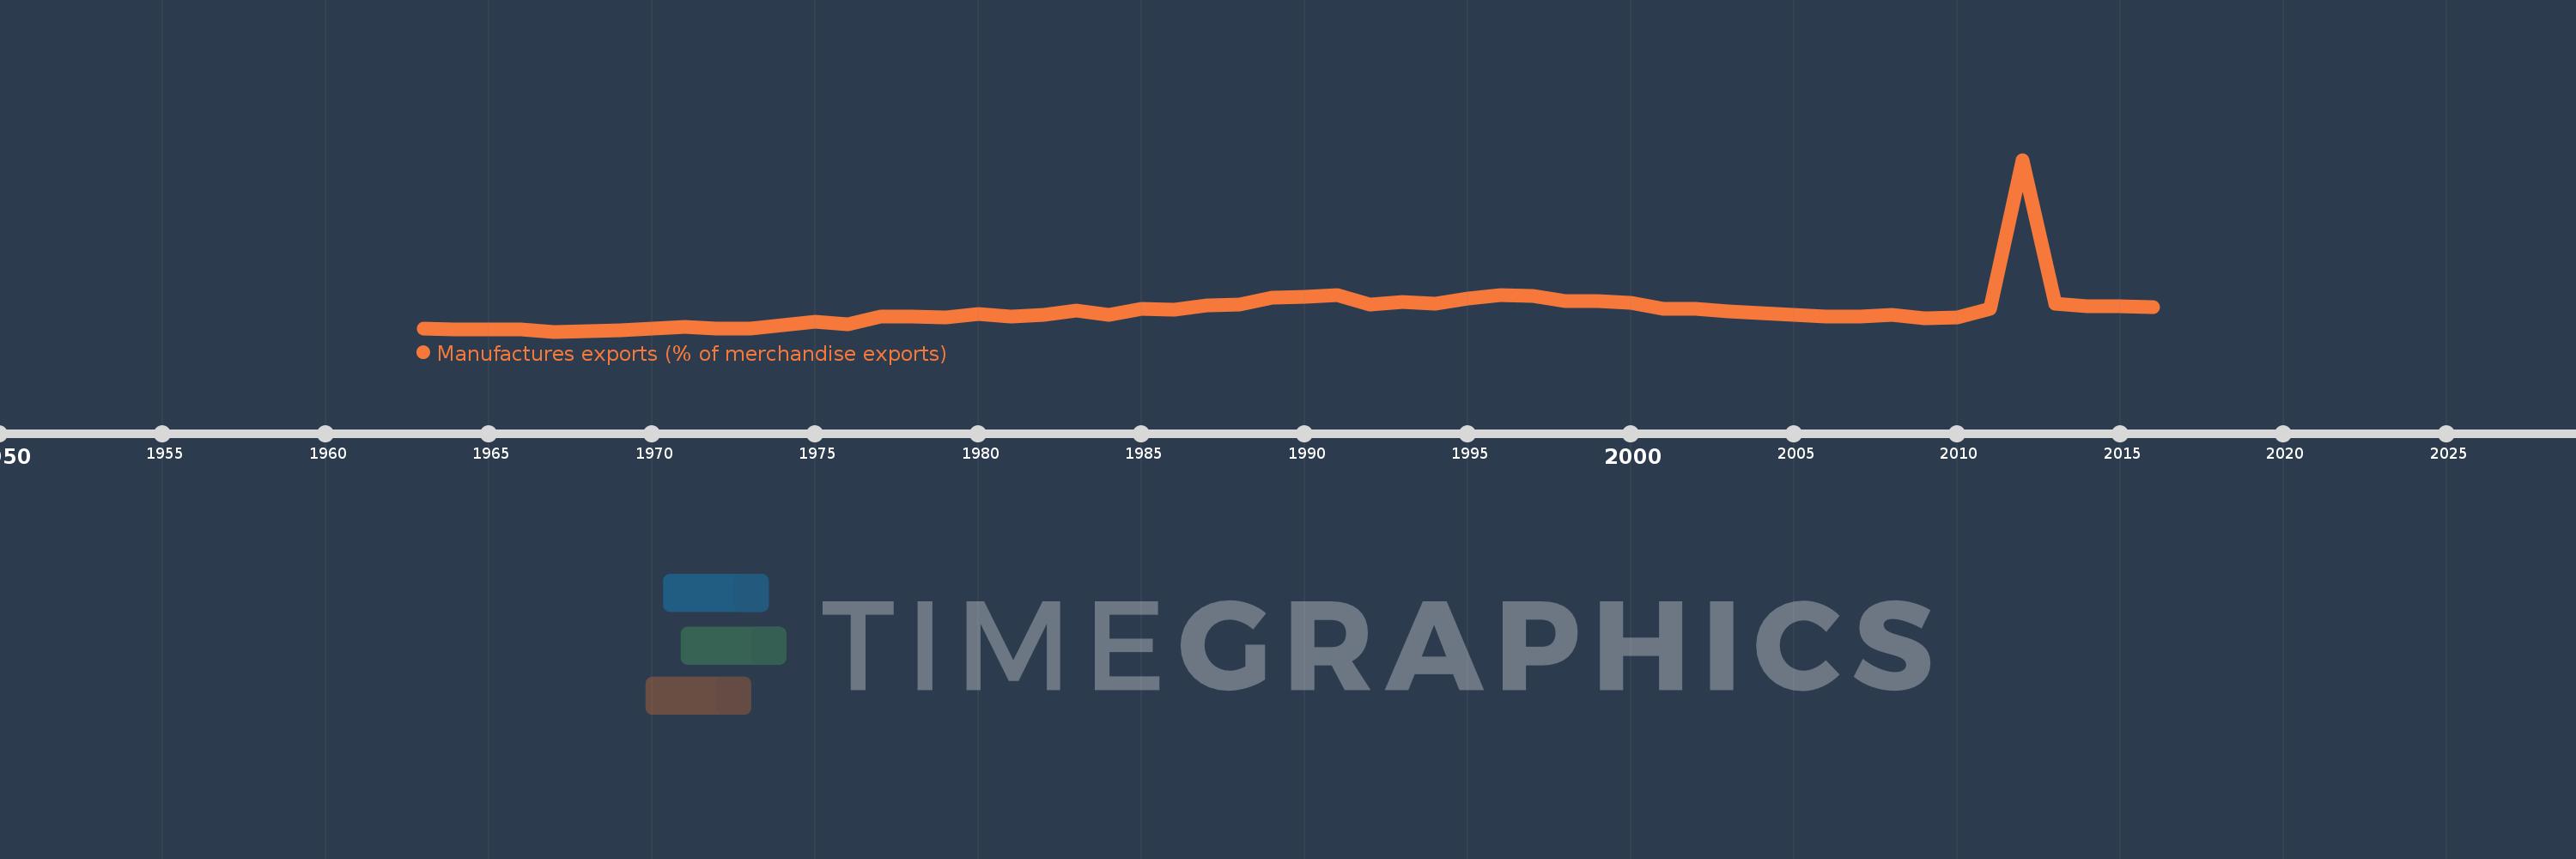
Manufactures exports (% of merchandise exports)
2016,2015,2014,2013,2012,2011,2010,2009,2008,2007,2006,2005,2004,2003,2002,2001,2000,1999,1998,1997,1996,1995,1994,1993,1992,1991,1990,1989,1988,1987,1986,1985,1984,1983,1982,1981,1980,1979,1978,1977,1976,1975,1974,1973,1972,1971,1970,1969,1968,1967,1966,1965,1964,1963
Estas estatísticas em outros países:
AfghanistanAlbaniaAlgeriaAndorraAngolaAntigua and BarbudaArab WorldArgentinaArmeniaArubaAustraliaAustriaAzerbaijanBahamas, TheBahrainBangladeshBarbadosBelarusBelgiumBelizeBeninBermudaBhutanBoliviaBosnia and HerzegovinaBotswanaBrazilBrunei DarussalamBulgariaBurkina FasoBurundiCabo VerdeCambodiaCameroonCanadaCaribbean small statesCayman IslandsCentral African RepublicCentral Europe and the BalticsChadChileChinaColombiaComorosCongo, Dem. Rep.Congo, Rep.Costa RicaCote d'IvoireCroatiaCubaCyprusCzech RepublicDenmarkDjiboutiDominicaDominican RepublicEarly-demographic dividendEast Asia & PacificEast Asia & Pacific (excluding high income)East Asia & Pacific (IDA & IBRD countries)EcuadorEgypt, Arab Rep.El SalvadorEquatorial GuineaEritreaEstoniaEthiopiaEuro areaEurope & Central AsiaEurope & Central Asia (excluding high income)Europe & Central Asia (IDA & IBRD countries)European UnionFaroe IslandsFijiFinlandFragile and conflict affected situationsFranceFrench PolynesiaGabonGambia, TheGeorgiaGermanyGhanaGreeceGreenlandGrenadaGuatemalaGuineaGuinea-BissauGuyanaHaitiHeavily indebted poor countries (HIPC)High incomeHondurasHong Kong SAR, ChinaHungaryIBRD onlyIcelandIDA & IBRD totalIDA blendIDA onlyIDA totalIndiaIndonesiaIran, Islamic Rep.IraqIrelandIsraelItalyJamaicaJapanJordanKazakhstanKenyaKiribatiKorea, Rep.KuwaitKyrgyz RepublicLao PDRLate-demographic dividendLatin America & Caribbean Latin America & Caribbean (excluding high income)Latin America & the Caribbean (IDA & IBRD countries)LatviaLeast developed countries: UN classificationLebanonLesothoLiberiaLibyaLithuaniaLow & middle incomeLower middle incomeLuxembourgMacao SAR, ChinaMacedonia, FYRMadagascarMalawiMalaysiaMaldivesMaliMaltaMauritaniaMauritiusMexicoMiddle East & North AfricaMiddle East & North Africa (excluding high income)Middle East & North Africa (IDA & IBRD countries)Middle incomeMoldovaMongoliaMoroccoMozambiqueMyanmarNamibiaNepalNetherlandsNew CaledoniaNew ZealandNicaraguaNigerNigeriaNorth AmericaNorwayOECD membersOmanOther small statesPacific island small statesPakistanPalauPanamaPapua New GuineaParaguayPeruPhilippinesPolandPortugalPost-demographic dividendPre-demographic dividendQatarRomaniaRussian FederationRwandaSamoaSao Tome and PrincipeSaudi ArabiaSenegalSerbiaSeychellesSierra LeoneSingaporeSlovak RepublicSloveniaSmall statesSolomon IslandsSomaliaSouth AfricaSouth AsiaSouth Asia (IDA & IBRD)SpainSri LankaSt. Kitts and NevisSt. LuciaSt. Vincent and the GrenadinesSub-Saharan Africa Sub-Saharan Africa (excluding high income)Sub-Saharan Africa (IDA & IBRD countries)SudanSurinameSwazilandSwedenSwitzerlandSyrian Arab RepublicTajikistanTanzaniaThailandTimor-LesteTogoTongaTrinidad and TobagoTunisiaTurkeyTurkmenistanTurks and Caicos IslandsTuvaluUgandaUkraineUnited Arab EmiratesUnited KingdomUnited StatesUpper middle incomeUruguayVanuatuVenezuela, RBVietnamVirgin Islands (U.S.)WorldYemen, Rep.ZambiaZimbabwe Linha do tempo:
Nesta escala de tempo está apresentado um gráfico de 1963 ano até 2016 ano Panama. Dados de 1962 ano ausente. O número de observações reais por data: 54.
Fonte (nome):
Indicadores de desenvolvimento mundial
Fonte (organização):
World Bank staff estimates from the Comtrade database maintained by the United Nations Statistics Division.
Categorias:
Private Sector, Trade
Foi atualizado:
23 abr 2017 ano
Indicadores de alterações dos valores ao longo dos anos
Mínimo:
0.885
1 jan 1967 ano
Máximo:
93.461
1 jan 2012 ano
Na data de observação
Valor
Mudança absoluta
A alteração em relação ao valor anterior
1 jan 1963 ano
2.704
+2.704
0.0%
1 jan 1964 ano
2.004
-0.7
-25.87%
1 jan 1965 ano
1.927
-0.078
-3.87%
1 jan 1966 ano
1.923
-0.004
-0.2%
1 jan 1967 ano
0.885
-1.038
-53.96%
1 jan 1968 ano
1.077
+0.192
21.7%
1 jan 1969 ano
1.679
+0.602
55.86%
1 jan 1970 ano
2.275
+0.596
35.49%
1 jan 1971 ano
3.561
+1.286
56.54%
1 jan 1972 ano
2.445
-1.116
-31.35%
1 jan 1973 ano
2.72
+0.275
11.24%
1 jan 1974 ano
4.546
+1.826
67.15%
1 jan 1975 ano
6.373
+1.827
40.18%
1 jan 1976 ano
4.722
-1.65
-25.9%
1 jan 1977 ano
9.206
+4.484
94.95%
1 jan 1978 ano
9.147
-0.06
-0.65%
1 jan 1979 ano
8.631
-0.516
-5.64%
1 jan 1980 ano
10.394
+1.763
20.43%
1 jan 1981 ano
8.907
-1.487
-14.31%
1 jan 1982 ano
9.822
+0.915
10.27%
1 jan 1983 ano
12.451
+2.629
26.77%
1 jan 1984 ano
9.717
-2.734
-21.96%
1 jan 1985 ano
13.381
+3.664
37.71%
1 jan 1986 ano
12.803
-0.578
-4.32%
1 jan 1987 ano
15.116
+2.313
18.07%
1 jan 1988 ano
15.679
+0.563
3.72%
1 jan 1989 ano
19.24
+3.561
22.71%
1 jan 1990 ano
19.519
+0.279
1.45%
1 jan 1991 ano
20.585
+1.067
5.46%
1 jan 1992 ano
15.612
-4.973
-24.16%
1 jan 1993 ano
16.708
+1.097
7.02%
1 jan 1994 ano
15.808
-0.9
-5.39%
1 jan 1995 ano
18.581
+2.773
17.54%
1 jan 1996 ano
20.348
+1.767
9.51%
1 jan 1997 ano
20.299
-0.049
-0.24%
1 jan 1998 ano
17.442
-2.857
-14.07%
1 jan 1999 ano
17.34
-0.102
-0.59%
1 jan 2000 ano
16.567
-0.772
-4.45%
1 jan 2001 ano
12.994
-3.573
-21.57%
1 jan 2002 ano
13.137
+0.143
1.1%
1 jan 2003 ano
11.978
-1.159
-8.83%
1 jan 2004 ano
10.773
-1.205
-10.06%
1 jan 2005 ano
9.98
-0.793
-7.36%
1 jan 2006 ano
9.051
-0.929
-9.31%
1 jan 2007 ano
9.131
+0.08
0.88%
1 jan 2008 ano
9.781
+0.65
7.12%
1 jan 2009 ano
8.105
-1.676
-17.14%
1 jan 2010 ano
8.478
+0.374
4.61%
1 jan 2011 ano
13.192
+4.714
55.6%
1 jan 2012 ano
93.461
+80.268
608.45%
1 jan 2013 ano
15.934
-77.526
-82.95%
1 jan 2014 ano
14.394
-1.54
-9.67%
1 jan 2015 ano
14.562
+0.167
1.16%
1 jan 2016 ano
14.141
-0.421
-2.89%
Classificação de países por estatísticas atuais por anos


Comentários: