29
/pt/
pt
AIzaSyAYiBZKx7MnpbEhh9jyipgxe19OcubqV5w
April 1, 2024
47328
Lower middle income
LMC
false
2
1
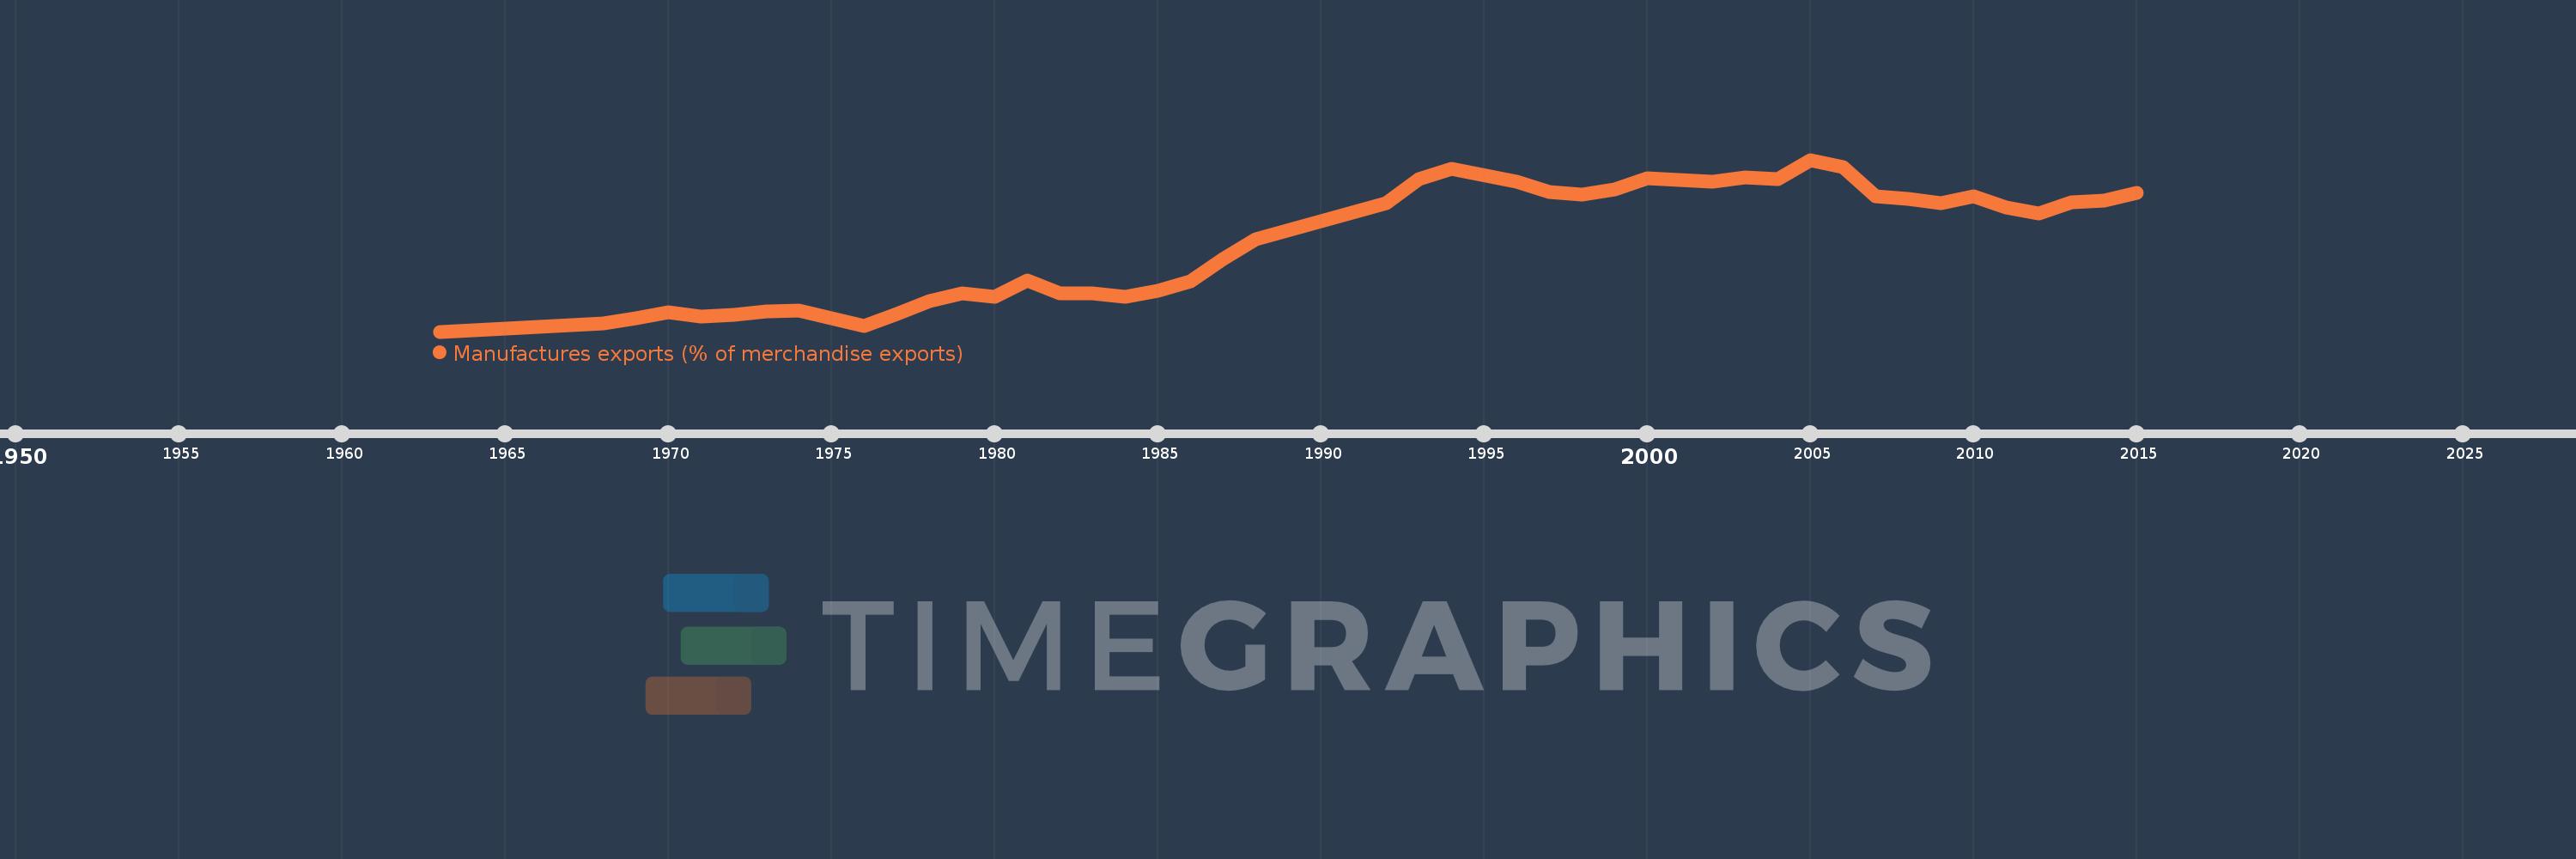
Manufactures exports (% of merchandise exports)
2015,2014,2013,2012,2011,2010,2009,2008,2007,2006,2005,2004,2003,2002,2001,2000,1999,1998,1997,1996,1994,1993,1992,1988,1987,1986,1985,1984,1983,1982,1981,1980,1979,1978,1977,1976,1975,1974,1973,1972,1971,1970,1969,1968,1963
Estas estatísticas em outros países:
AfghanistanAlbaniaAlgeriaAndorraAngolaAntigua and BarbudaArab WorldArgentinaArmeniaArubaAustraliaAustriaAzerbaijanBahamas, TheBahrainBangladeshBarbadosBelarusBelgiumBelizeBeninBermudaBhutanBoliviaBosnia and HerzegovinaBotswanaBrazilBrunei DarussalamBulgariaBurkina FasoBurundiCabo VerdeCambodiaCameroonCanadaCaribbean small statesCayman IslandsCentral African RepublicCentral Europe and the BalticsChadChileChinaColombiaComorosCongo, Dem. Rep.Congo, Rep.Costa RicaCote d'IvoireCroatiaCubaCyprusCzech RepublicDenmarkDjiboutiDominicaDominican RepublicEarly-demographic dividendEast Asia & PacificEast Asia & Pacific (excluding high income)East Asia & Pacific (IDA & IBRD countries)EcuadorEgypt, Arab Rep.El SalvadorEquatorial GuineaEritreaEstoniaEthiopiaEuro areaEurope & Central AsiaEurope & Central Asia (excluding high income)Europe & Central Asia (IDA & IBRD countries)European UnionFaroe IslandsFijiFinlandFragile and conflict affected situationsFranceFrench PolynesiaGabonGambia, TheGeorgiaGermanyGhanaGreeceGreenlandGrenadaGuatemalaGuineaGuinea-BissauGuyanaHaitiHeavily indebted poor countries (HIPC)High incomeHondurasHong Kong SAR, ChinaHungaryIBRD onlyIcelandIDA & IBRD totalIDA blendIDA onlyIDA totalIndiaIndonesiaIran, Islamic Rep.IraqIrelandIsraelItalyJamaicaJapanJordanKazakhstanKenyaKiribatiKorea, Rep.KuwaitKyrgyz RepublicLao PDRLate-demographic dividendLatin America & Caribbean Latin America & Caribbean (excluding high income)Latin America & the Caribbean (IDA & IBRD countries)LatviaLeast developed countries: UN classificationLebanonLesothoLiberiaLibyaLithuaniaLow & middle incomeLower middle incomeLuxembourgMacao SAR, ChinaMacedonia, FYRMadagascarMalawiMalaysiaMaldivesMaliMaltaMauritaniaMauritiusMexicoMiddle East & North AfricaMiddle East & North Africa (excluding high income)Middle East & North Africa (IDA & IBRD countries)Middle incomeMoldovaMongoliaMoroccoMozambiqueMyanmarNamibiaNepalNetherlandsNew CaledoniaNew ZealandNicaraguaNigerNigeriaNorth AmericaNorwayOECD membersOmanOther small statesPacific island small statesPakistanPalauPanamaPapua New GuineaParaguayPeruPhilippinesPolandPortugalPost-demographic dividendPre-demographic dividendQatarRomaniaRussian FederationRwandaSamoaSao Tome and PrincipeSaudi ArabiaSenegalSerbiaSeychellesSierra LeoneSingaporeSlovak RepublicSloveniaSmall statesSolomon IslandsSomaliaSouth AfricaSouth AsiaSouth Asia (IDA & IBRD)SpainSri LankaSt. Kitts and NevisSt. LuciaSt. Vincent and the GrenadinesSub-Saharan Africa Sub-Saharan Africa (excluding high income)Sub-Saharan Africa (IDA & IBRD countries)SudanSurinameSwazilandSwedenSwitzerlandSyrian Arab RepublicTajikistanTanzaniaThailandTimor-LesteTogoTongaTrinidad and TobagoTunisiaTurkeyTurkmenistanTurks and Caicos IslandsTuvaluUgandaUkraineUnited Arab EmiratesUnited KingdomUnited StatesUpper middle incomeUruguayVanuatuVenezuela, RBVietnamVirgin Islands (U.S.)WorldYemen, Rep.ZambiaZimbabwe Linha do tempo:
Nesta escala de tempo está apresentado um gráfico de 1963 ano até 2015 ano Lower middle income. Dados de 1962 ano ausente. O número de observações reais por data: 45.
Fonte (nome):
Indicadores de desenvolvimento mundial
Fonte (organização):
World Bank staff estimates from the Comtrade database maintained by the United Nations Statistics Division.
Categorias:
Private Sector, Trade
Foi atualizado:
23 abr 2017 ano
Indicadores de alterações dos valores ao longo dos anos
Mínimo:
18.695
1 jan 1963 ano
Máximo:
59.619
1 jan 2005 ano
Na data de observação
Valor
Mudança absoluta
A alteração em relação ao valor anterior
1 jan 1963 ano
18.695
+18.695
0.0%
1 jan 1968 ano
20.666
+1.971
10.54%
1 jan 1969 ano
21.801
+1.135
5.49%
1 jan 1970 ano
23.227
+1.426
6.54%
1 jan 1971 ano
22.216
-1.011
-4.35%
1 jan 1972 ano
22.648
+0.432
1.95%
1 jan 1973 ano
23.415
+0.767
3.38%
1 jan 1974 ano
23.705
+0.29
1.24%
1 jan 1975 ano
21.812
-1.893
-7.98%
1 jan 1976 ano
20.063
-1.749
-8.02%
1 jan 1977 ano
22.837
+2.773
13.82%
1 jan 1978 ano
25.871
+3.034
13.29%
1 jan 1979 ano
27.753
+1.883
7.28%
1 jan 1980 ano
27.033
-0.721
-2.6%
1 jan 1981 ano
30.795
+3.763
13.92%
1 jan 1982 ano
27.843
-2.952
-9.58%
1 jan 1983 ano
27.892
+0.048
0.17%
1 jan 1984 ano
26.979
-0.913
-3.27%
1 jan 1985 ano
28.364
+1.385
5.14%
1 jan 1986 ano
30.66
+2.296
8.09%
1 jan 1987 ano
35.956
+5.296
17.27%
1 jan 1988 ano
40.59
+4.634
12.89%
1 jan 1992 ano
49.38
+8.79
21.66%
1 jan 1993 ano
55.0
+5.621
11.38%
1 jan 1994 ano
57.566
+2.565
4.66%
1 jan 1996 ano
54.421
-3.144
-5.46%
1 jan 1997 ano
51.979
-2.443
-4.49%
1 jan 1998 ano
51.258
-0.72
-1.39%
1 jan 1999 ano
52.659
+1.4
2.73%
1 jan 2000 ano
55.138
+2.479
4.71%
1 jan 2001 ano
54.841
-0.298
-0.54%
1 jan 2002 ano
54.309
-0.531
-0.97%
1 jan 2003 ano
55.362
+1.052
1.94%
1 jan 2004 ano
54.969
-0.392
-0.71%
1 jan 2005 ano
59.619
+4.65
8.46%
1 jan 2006 ano
57.889
-1.73
-2.9%
1 jan 2007 ano
50.944
-6.945
-12.0%
1 jan 2008 ano
50.346
-0.598
-1.17%
1 jan 2009 ano
49.265
-1.081
-2.15%
1 jan 2010 ano
50.883
+1.618
3.28%
1 jan 2011 ano
48.171
-2.713
-5.33%
1 jan 2012 ano
46.849
-1.321
-2.74%
1 jan 2013 ano
49.568
+2.719
5.8%
1 jan 2014 ano
49.895
+0.327
0.66%
1 jan 2015 ano
51.815
+1.92
3.85%
Classificação de países por estatísticas atuais por anos


Comentários: