29
/pt/
pt
AIzaSyAYiBZKx7MnpbEhh9jyipgxe19OcubqV5w
April 1, 2024
210636
Nicaragua
NIC
true
2
1
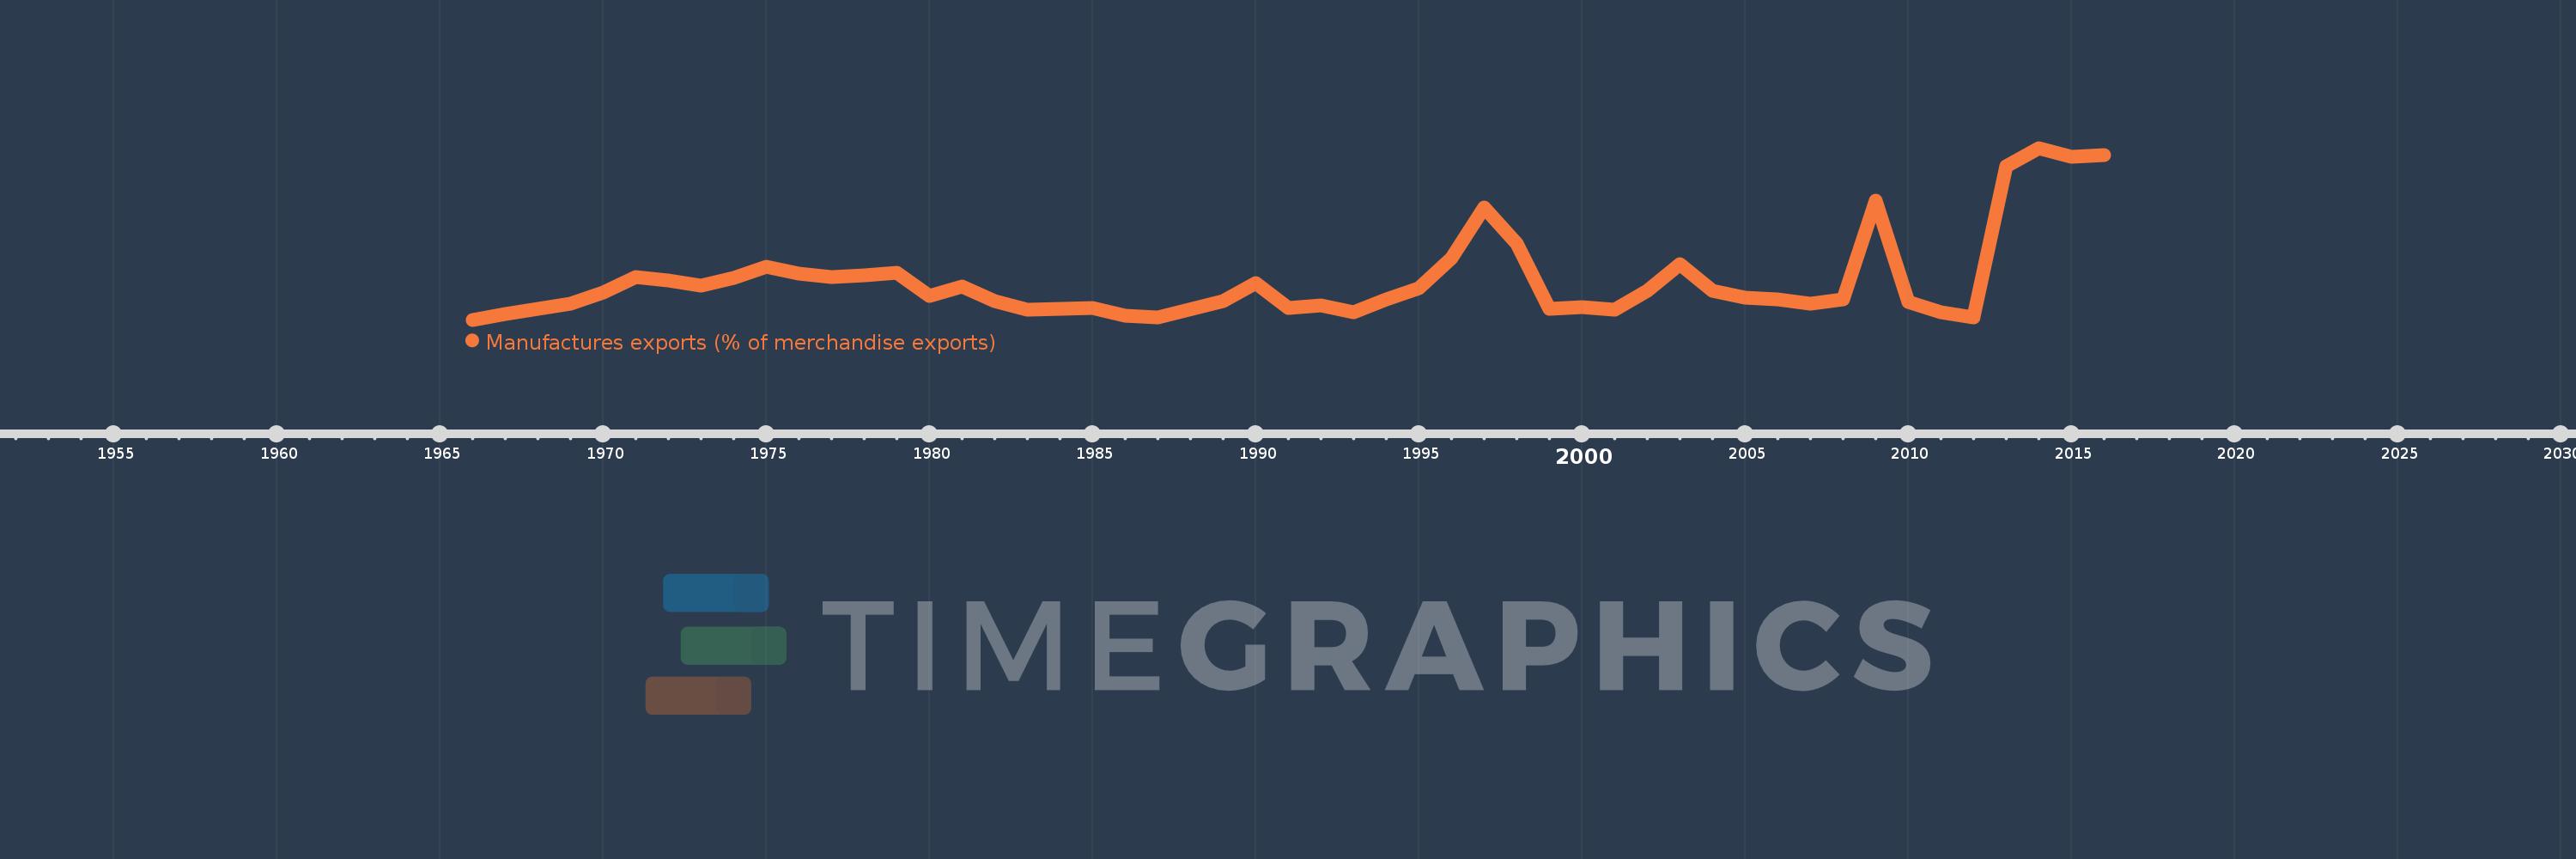
Manufactures exports (% of merchandise exports)
2016,2015,2014,2013,2012,2011,2010,2009,2008,2007,2006,2005,2004,2003,2002,2001,2000,1999,1998,1997,1996,1995,1994,1993,1992,1991,1990,1989,1987,1986,1985,1984,1983,1982,1981,1980,1979,1978,1977,1976,1975,1974,1973,1972,1971,1970,1969,1968,1967,1966
Estas estatísticas em outros países:
AfghanistanAlbaniaAlgeriaAndorraAngolaAntigua and BarbudaArab WorldArgentinaArmeniaArubaAustraliaAustriaAzerbaijanBahamas, TheBahrainBangladeshBarbadosBelarusBelgiumBelizeBeninBermudaBhutanBoliviaBosnia and HerzegovinaBotswanaBrazilBrunei DarussalamBulgariaBurkina FasoBurundiCabo VerdeCambodiaCameroonCanadaCaribbean small statesCayman IslandsCentral African RepublicCentral Europe and the BalticsChadChileChinaColombiaComorosCongo, Dem. Rep.Congo, Rep.Costa RicaCote d'IvoireCroatiaCubaCyprusCzech RepublicDenmarkDjiboutiDominicaDominican RepublicEarly-demographic dividendEast Asia & PacificEast Asia & Pacific (excluding high income)East Asia & Pacific (IDA & IBRD countries)EcuadorEgypt, Arab Rep.El SalvadorEquatorial GuineaEritreaEstoniaEthiopiaEuro areaEurope & Central AsiaEurope & Central Asia (excluding high income)Europe & Central Asia (IDA & IBRD countries)European UnionFaroe IslandsFijiFinlandFragile and conflict affected situationsFranceFrench PolynesiaGabonGambia, TheGeorgiaGermanyGhanaGreeceGreenlandGrenadaGuatemalaGuineaGuinea-BissauGuyanaHaitiHeavily indebted poor countries (HIPC)High incomeHondurasHong Kong SAR, ChinaHungaryIBRD onlyIcelandIDA & IBRD totalIDA blendIDA onlyIDA totalIndiaIndonesiaIran, Islamic Rep.IraqIrelandIsraelItalyJamaicaJapanJordanKazakhstanKenyaKiribatiKorea, Rep.KuwaitKyrgyz RepublicLao PDRLate-demographic dividendLatin America & Caribbean Latin America & Caribbean (excluding high income)Latin America & the Caribbean (IDA & IBRD countries)LatviaLeast developed countries: UN classificationLebanonLesothoLiberiaLibyaLithuaniaLow & middle incomeLower middle incomeLuxembourgMacao SAR, ChinaMacedonia, FYRMadagascarMalawiMalaysiaMaldivesMaliMaltaMauritaniaMauritiusMexicoMiddle East & North AfricaMiddle East & North Africa (excluding high income)Middle East & North Africa (IDA & IBRD countries)Middle incomeMoldovaMongoliaMoroccoMozambiqueMyanmarNamibiaNepalNetherlandsNew CaledoniaNew ZealandNicaraguaNigerNigeriaNorth AmericaNorwayOECD membersOmanOther small statesPacific island small statesPakistanPalauPanamaPapua New GuineaParaguayPeruPhilippinesPolandPortugalPost-demographic dividendPre-demographic dividendQatarRomaniaRussian FederationRwandaSamoaSao Tome and PrincipeSaudi ArabiaSenegalSerbiaSeychellesSierra LeoneSingaporeSlovak RepublicSloveniaSmall statesSolomon IslandsSomaliaSouth AfricaSouth AsiaSouth Asia (IDA & IBRD)SpainSri LankaSt. Kitts and NevisSt. LuciaSt. Vincent and the GrenadinesSub-Saharan Africa Sub-Saharan Africa (excluding high income)Sub-Saharan Africa (IDA & IBRD countries)SudanSurinameSwazilandSwedenSwitzerlandSyrian Arab RepublicTajikistanTanzaniaThailandTimor-LesteTogoTongaTrinidad and TobagoTunisiaTurkeyTurkmenistanTurks and Caicos IslandsTuvaluUgandaUkraineUnited Arab EmiratesUnited KingdomUnited StatesUpper middle incomeUruguayVanuatuVenezuela, RBVietnamVirgin Islands (U.S.)WorldYemen, Rep.ZambiaZimbabwe Linha do tempo:
Nesta escala de tempo está apresentado um gráfico de 1966 ano até 2016 ano Nicaragua. Dados de 1965 ano ausente. O número de observações reais por data: 50.
Fonte (nome):
Indicadores de desenvolvimento mundial
Fonte (organização):
World Bank staff estimates from the Comtrade database maintained by the United Nations Statistics Division.
Categorias:
Private Sector, Trade
Foi atualizado:
23 abr 2017 ano
Indicadores de alterações dos valores ao longo dos anos
Mínimo:
5.304
1 jan 1966 ano
Máximo:
48.598
1 jan 2014 ano
Na data de observação
Valor
Mudança absoluta
A alteração em relação ao valor anterior
1 jan 1966 ano
5.304
+5.304
0.0%
1 jan 1967 ano
6.742
+1.438
27.12%
1 jan 1968 ano
8.132
+1.39
20.62%
1 jan 1969 ano
9.291
+1.159
14.26%
1 jan 1970 ano
12.113
+2.822
30.37%
1 jan 1971 ano
16.038
+3.925
32.4%
1 jan 1972 ano
15.218
-0.82
-5.11%
1 jan 1973 ano
13.811
-1.408
-9.25%
1 jan 1974 ano
15.859
+2.048
14.83%
1 jan 1975 ano
18.675
+2.816
17.76%
1 jan 1976 ano
16.88
-1.795
-9.61%
1 jan 1977 ano
16.08
-0.8
-4.74%
1 jan 1978 ano
16.594
+0.514
3.2%
1 jan 1979 ano
17.039
+0.445
2.68%
1 jan 1980 ano
11.354
-5.684
-33.36%
1 jan 1981 ano
13.788
+2.434
21.44%
1 jan 1982 ano
9.924
-3.865
-28.03%
1 jan 1983 ano
7.76
-2.164
-21.81%
1 jan 1984 ano
8.092
+0.333
4.29%
1 jan 1985 ano
8.297
+0.205
2.53%
1 jan 1986 ano
6.313
-1.984
-23.91%
1 jan 1987 ano
5.789
-0.523
-8.29%
1 jan 1989 ano
10.087
+4.298
74.25%
1 jan 1990 ano
14.498
+4.411
43.73%
1 jan 1991 ano
8.277
-6.221
-42.91%
1 jan 1992 ano
8.97
+0.693
8.37%
1 jan 1993 ano
7.197
-1.773
-19.77%
1 jan 1994 ano
10.51
+3.313
46.04%
1 jan 1995 ano
13.274
+2.764
26.29%
1 jan 1996 ano
20.718
+7.444
56.08%
1 jan 1997 ano
33.682
+12.964
62.57%
1 jan 1998 ano
24.571
-9.111
-27.05%
1 jan 1999 ano
8.14
-16.431
-66.87%
1 jan 2000 ano
8.557
+0.417
5.12%
1 jan 2001 ano
7.816
-0.741
-8.65%
1 jan 2002 ano
12.55
+4.734
60.57%
1 jan 2003 ano
19.283
+6.732
53.64%
1 jan 2004 ano
12.497
-6.786
-35.19%
1 jan 2005 ano
10.882
-1.615
-12.92%
1 jan 2006 ano
10.519
-0.363
-3.33%
1 jan 2007 ano
9.403
-1.116
-10.61%
1 jan 2008 ano
10.394
+0.991
10.54%
1 jan 2009 ano
35.256
+24.862
239.2%
1 jan 2010 ano
9.726
-25.53
-72.41%
1 jan 2011 ano
7.148
-2.578
-26.51%
1 jan 2012 ano
5.914
-1.234
-17.26%
1 jan 2013 ano
43.894
+37.979
642.16%
1 jan 2014 ano
48.598
+4.704
10.72%
1 jan 2015 ano
46.326
-2.272
-4.67%
1 jan 2016 ano
46.845
+0.519
1.12%
Classificação de países por estatísticas atuais por anos


Comentários: