30
/pt/
AIzaSyAYiBZKx7MnpbEhh9jyipgxe19OcubqV5w
April 1, 2024
49198
Middle East & North Africa (excluding high income)
MNA
false
2
1
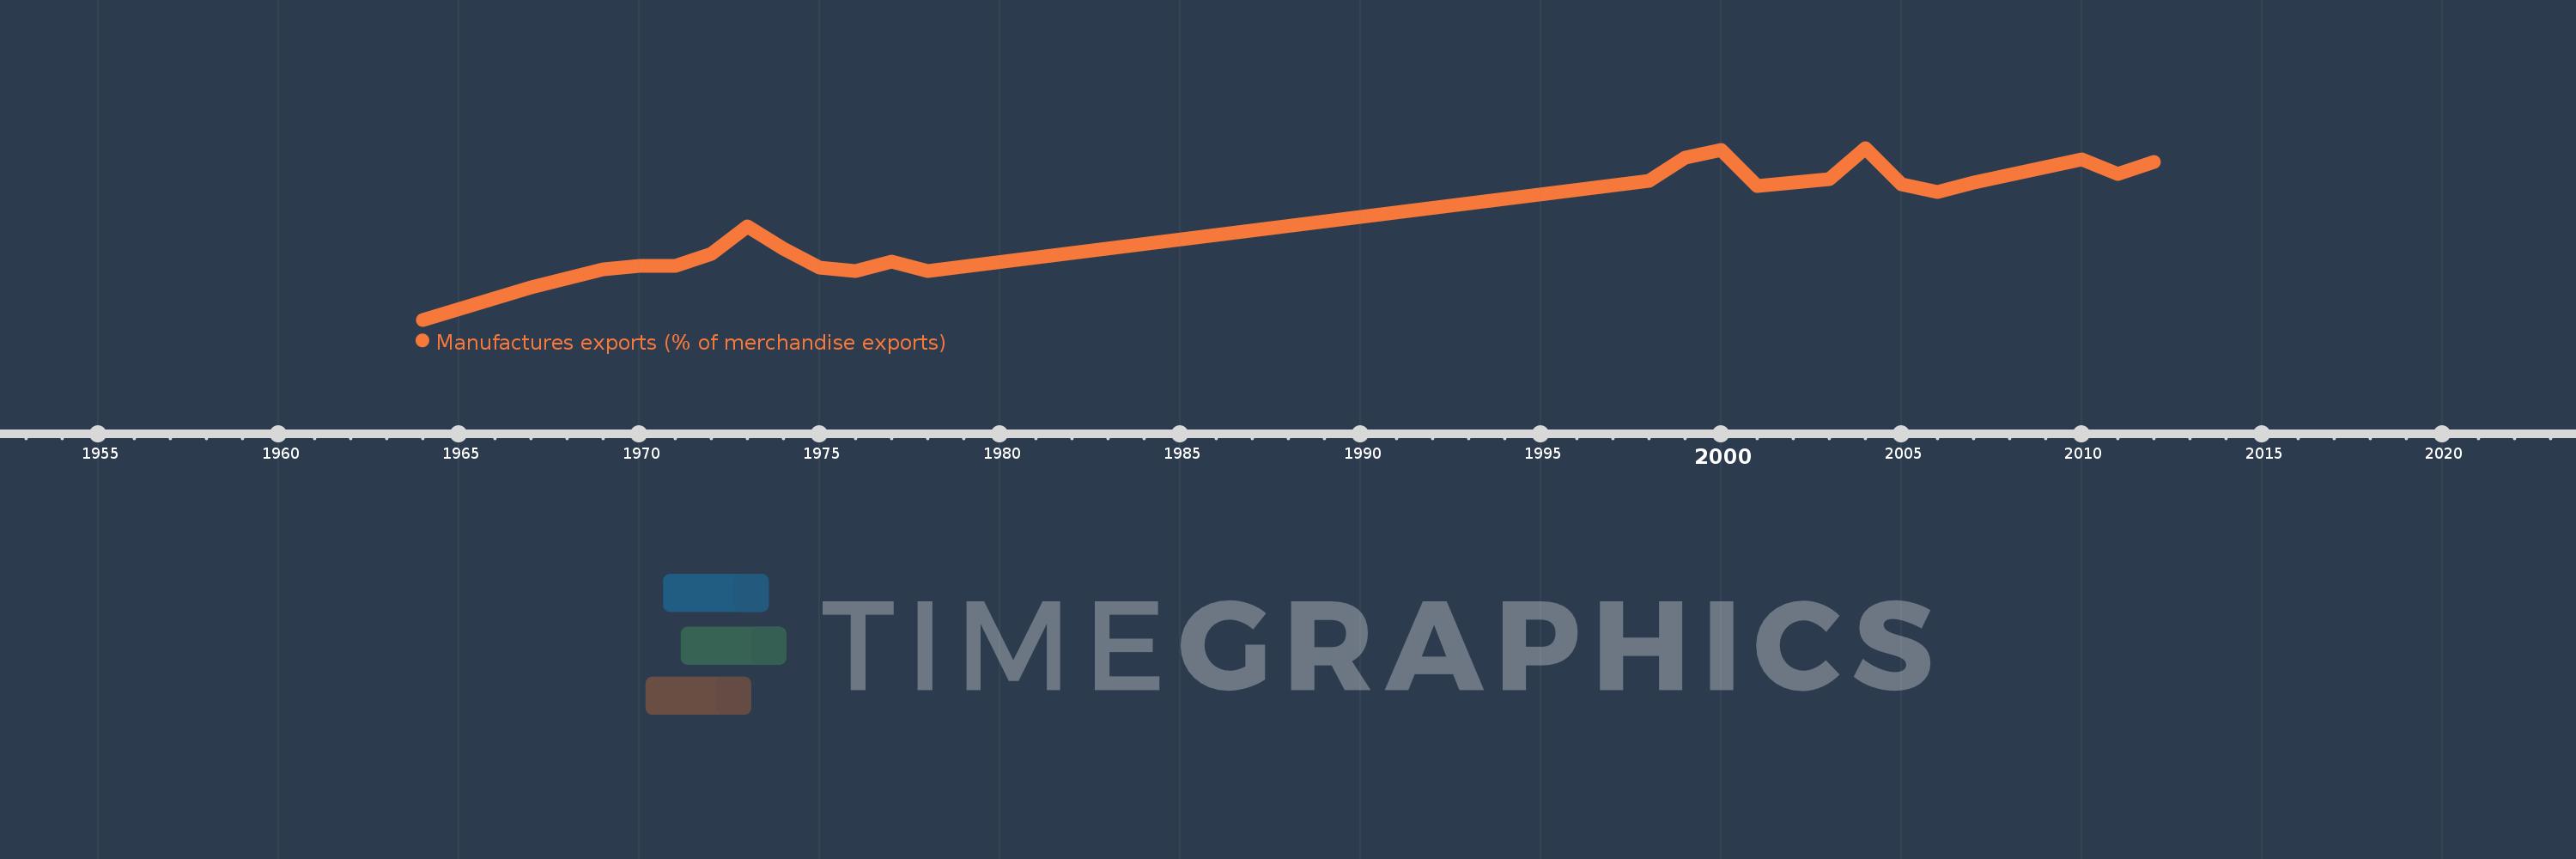
Manufactures exports (% of merchandise exports)
2012,2011,2010,2007,2006,2005,2004,2003,2002,2001,2000,1999,1998,1978,1977,1976,1975,1974,1973,1972,1971,1970,1969,1967,1964
