29
/pt/
pt
AIzaSyAYiBZKx7MnpbEhh9jyipgxe19OcubqV5w
April 1, 2024
213217
Nigeria
NGA
true
2
1
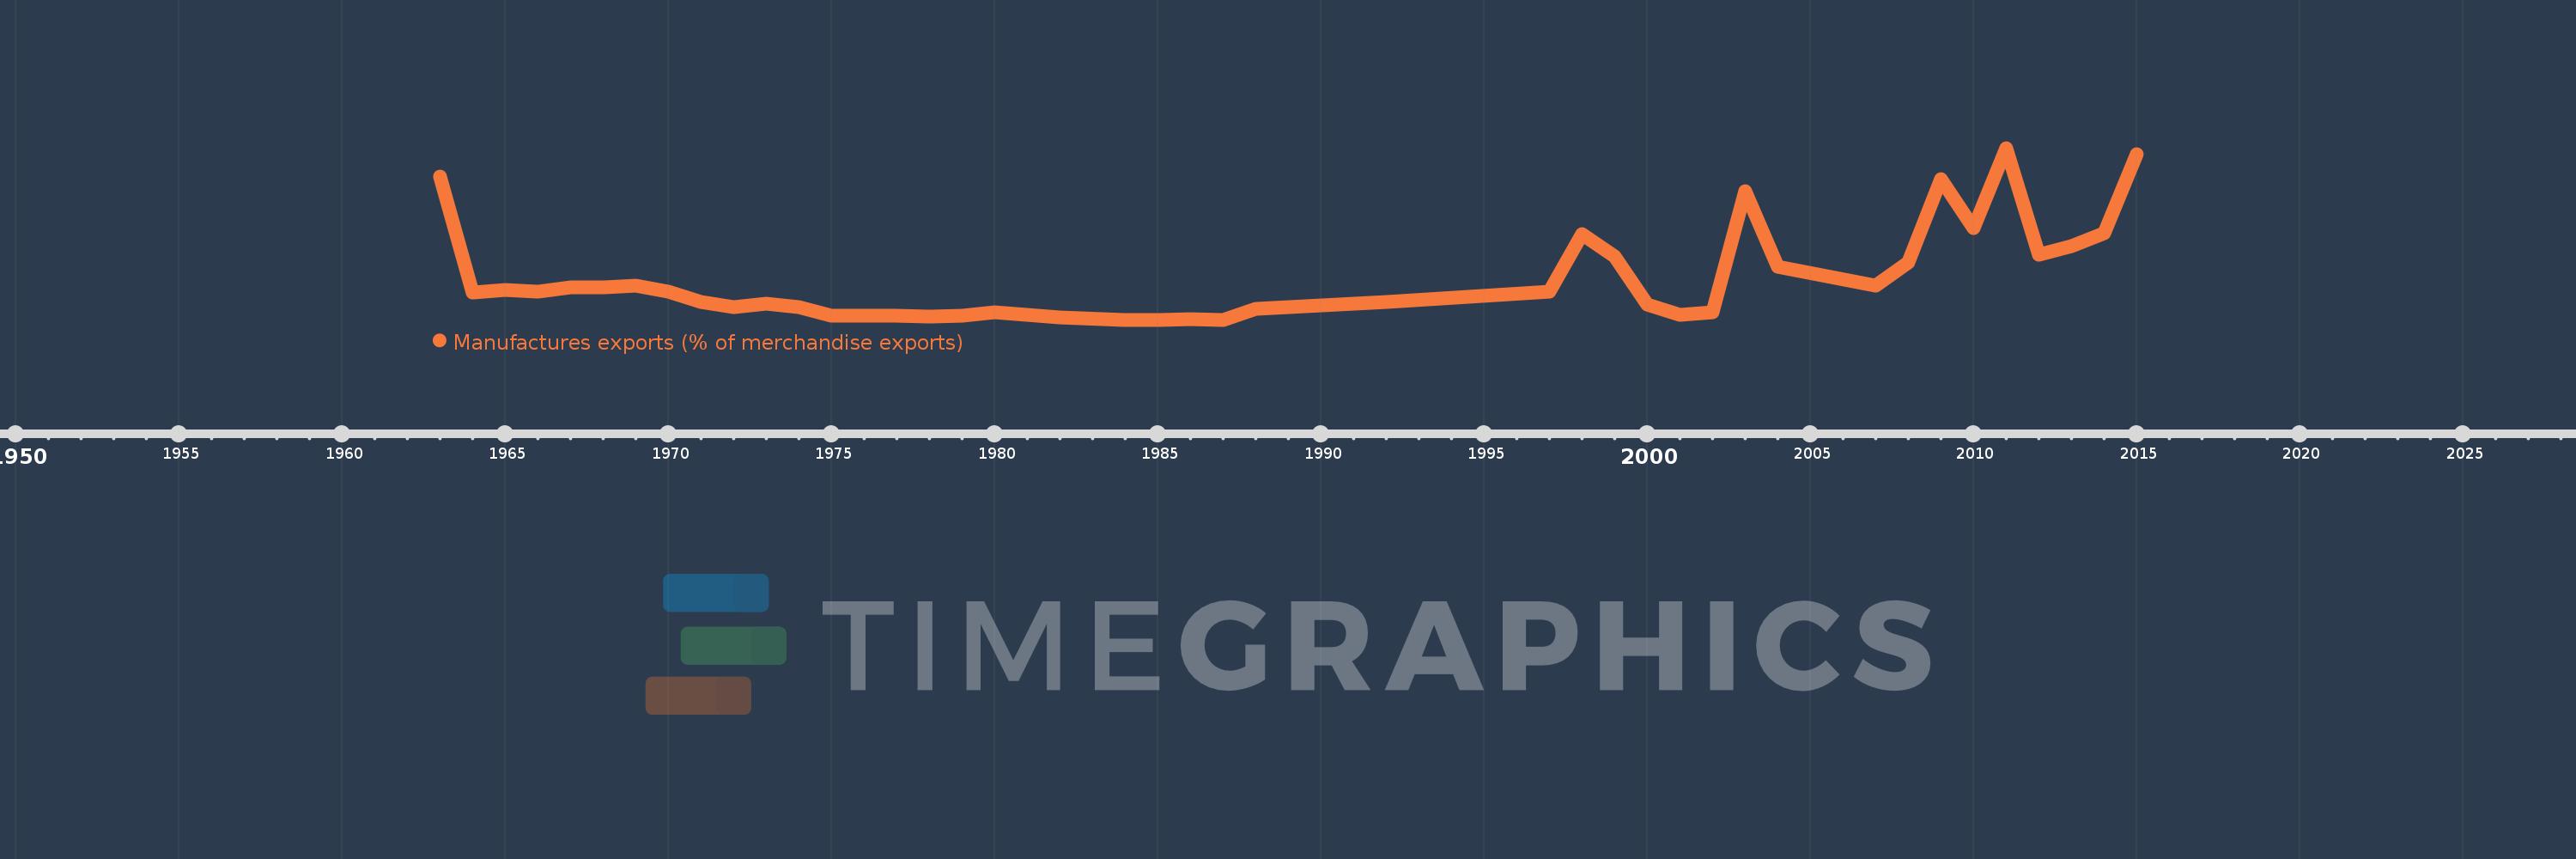
Manufactures exports (% of merchandise exports)
2015,2014,2013,2012,2011,2010,2009,2008,2007,2004,2003,2002,2001,2000,1999,1998,1997,1992,1988,1987,1986,1985,1984,1982,1980,1979,1978,1977,1976,1975,1974,1973,1972,1971,1970,1969,1968,1967,1966,1965,1964,1963
Estas estatísticas em outros países:
AfghanistanAlbaniaAlgeriaAndorraAngolaAntigua and BarbudaArab WorldArgentinaArmeniaArubaAustraliaAustriaAzerbaijanBahamas, TheBahrainBangladeshBarbadosBelarusBelgiumBelizeBeninBermudaBhutanBoliviaBosnia and HerzegovinaBotswanaBrazilBrunei DarussalamBulgariaBurkina FasoBurundiCabo VerdeCambodiaCameroonCanadaCaribbean small statesCayman IslandsCentral African RepublicCentral Europe and the BalticsChadChileChinaColombiaComorosCongo, Dem. Rep.Congo, Rep.Costa RicaCote d'IvoireCroatiaCubaCyprusCzech RepublicDenmarkDjiboutiDominicaDominican RepublicEarly-demographic dividendEast Asia & PacificEast Asia & Pacific (excluding high income)East Asia & Pacific (IDA & IBRD countries)EcuadorEgypt, Arab Rep.El SalvadorEquatorial GuineaEritreaEstoniaEthiopiaEuro areaEurope & Central AsiaEurope & Central Asia (excluding high income)Europe & Central Asia (IDA & IBRD countries)European UnionFaroe IslandsFijiFinlandFragile and conflict affected situationsFranceFrench PolynesiaGabonGambia, TheGeorgiaGermanyGhanaGreeceGreenlandGrenadaGuatemalaGuineaGuinea-BissauGuyanaHaitiHeavily indebted poor countries (HIPC)High incomeHondurasHong Kong SAR, ChinaHungaryIBRD onlyIcelandIDA & IBRD totalIDA blendIDA onlyIDA totalIndiaIndonesiaIran, Islamic Rep.IraqIrelandIsraelItalyJamaicaJapanJordanKazakhstanKenyaKiribatiKorea, Rep.KuwaitKyrgyz RepublicLao PDRLate-demographic dividendLatin America & Caribbean Latin America & Caribbean (excluding high income)Latin America & the Caribbean (IDA & IBRD countries)LatviaLeast developed countries: UN classificationLebanonLesothoLiberiaLibyaLithuaniaLow & middle incomeLower middle incomeLuxembourgMacao SAR, ChinaMacedonia, FYRMadagascarMalawiMalaysiaMaldivesMaliMaltaMauritaniaMauritiusMexicoMiddle East & North AfricaMiddle East & North Africa (excluding high income)Middle East & North Africa (IDA & IBRD countries)Middle incomeMoldovaMongoliaMoroccoMozambiqueMyanmarNamibiaNepalNetherlandsNew CaledoniaNew ZealandNicaraguaNigerNigeriaNorth AmericaNorwayOECD membersOmanOther small statesPacific island small statesPakistanPalauPanamaPapua New GuineaParaguayPeruPhilippinesPolandPortugalPost-demographic dividendPre-demographic dividendQatarRomaniaRussian FederationRwandaSamoaSao Tome and PrincipeSaudi ArabiaSenegalSerbiaSeychellesSierra LeoneSingaporeSlovak RepublicSloveniaSmall statesSolomon IslandsSomaliaSouth AfricaSouth AsiaSouth Asia (IDA & IBRD)SpainSri LankaSt. Kitts and NevisSt. LuciaSt. Vincent and the GrenadinesSub-Saharan Africa Sub-Saharan Africa (excluding high income)Sub-Saharan Africa (IDA & IBRD countries)SudanSurinameSwazilandSwedenSwitzerlandSyrian Arab RepublicTajikistanTanzaniaThailandTimor-LesteTogoTongaTrinidad and TobagoTunisiaTurkeyTurkmenistanTurks and Caicos IslandsTuvaluUgandaUkraineUnited Arab EmiratesUnited KingdomUnited StatesUpper middle incomeUruguayVanuatuVenezuela, RBVietnamVirgin Islands (U.S.)WorldYemen, Rep.ZambiaZimbabwe Linha do tempo:
Nesta escala de tempo está apresentado um gráfico de 1963 ano até 2015 ano Nigeria. Dados de 1962 ano ausente. O número de observações reais por data: 42.
Fonte (nome):
Indicadores de desenvolvimento mundial
Fonte (organização):
World Bank staff estimates from the Comtrade database maintained by the United Nations Statistics Division.
Categorias:
Private Sector, Trade
Foi atualizado:
23 abr 2017 ano
Indicadores de alterações dos valores ao longo dos anos
Mínimo:
0.023
1 jan 1985 ano
Máximo:
6.686
1 jan 2011 ano
Na data de observação
Valor
Mudança absoluta
A alteração em relação ao valor anterior
1 jan 1963 ano
5.565
+5.565
0.0%
1 jan 1964 ano
1.092
-4.472
-80.37%
1 jan 1965 ano
1.166
+0.074
6.77%
1 jan 1966 ano
1.115
-0.051
-4.39%
1 jan 1967 ano
1.273
+0.158
14.2%
1 jan 1968 ano
1.274
+0.0
0.04%
1 jan 1969 ano
1.341
+0.067
5.29%
1 jan 1970 ano
1.1
-0.241
-18.0%
1 jan 1971 ano
0.724
-0.376
-34.18%
1 jan 1972 ano
0.524
-0.2
-27.63%
1 jan 1973 ano
0.64
+0.116
22.18%
1 jan 1974 ano
0.505
-0.135
-21.15%
1 jan 1975 ano
0.195
-0.31
-61.45%
1 jan 1976 ano
0.171
-0.024
-12.33%
1 jan 1977 ano
0.189
+0.018
10.78%
1 jan 1978 ano
0.148
-0.041
-21.61%
1 jan 1979 ano
0.172
+0.024
15.94%
1 jan 1980 ano
0.298
+0.126
73.46%
1 jan 1982 ano
0.129
-0.169
-56.63%
1 jan 1984 ano
0.025
-0.104
-80.39%
1 jan 1985 ano
0.023
-0.003
-10.31%
1 jan 1986 ano
0.038
+0.015
66.7%
1 jan 1987 ano
0.024
-0.013
-35.37%
1 jan 1988 ano
0.435
+0.411
1.68 mil%
1 jan 1992 ano
0.697
+0.262
60.14%
1 jan 1997 ano
1.112
+0.415
59.48%
1 jan 1998 ano
3.358
+2.246
201.98%
1 jan 1999 ano
2.47
-0.888
-26.44%
1 jan 2000 ano
0.605
-1.865
-75.52%
1 jan 2001 ano
0.207
-0.398
-65.77%
1 jan 2002 ano
0.309
+0.102
49.2%
1 jan 2003 ano
5.014
+4.706
1.52 mil%
1 jan 2004 ano
2.068
-2.947
-58.77%
1 jan 2007 ano
1.338
-0.73
-35.29%
1 jan 2008 ano
2.242
+0.904
67.55%
1 jan 2009 ano
5.463
+3.221
143.7%
1 jan 2010 ano
3.589
-1.874
-34.31%
1 jan 2011 ano
6.686
+3.097
86.31%
1 jan 2012 ano
2.548
-4.138
-61.89%
1 jan 2013 ano
2.871
+0.323
12.69%
1 jan 2014 ano
3.392
+0.52
18.11%
1 jan 2015 ano
6.449
+3.058
90.15%
Classificação de países por estatísticas atuais por anos


Comentários: