29
/pt/
pt
AIzaSyAYiBZKx7MnpbEhh9jyipgxe19OcubqV5w
April 1, 2024
66262
Algeria
DZA
true
2
1
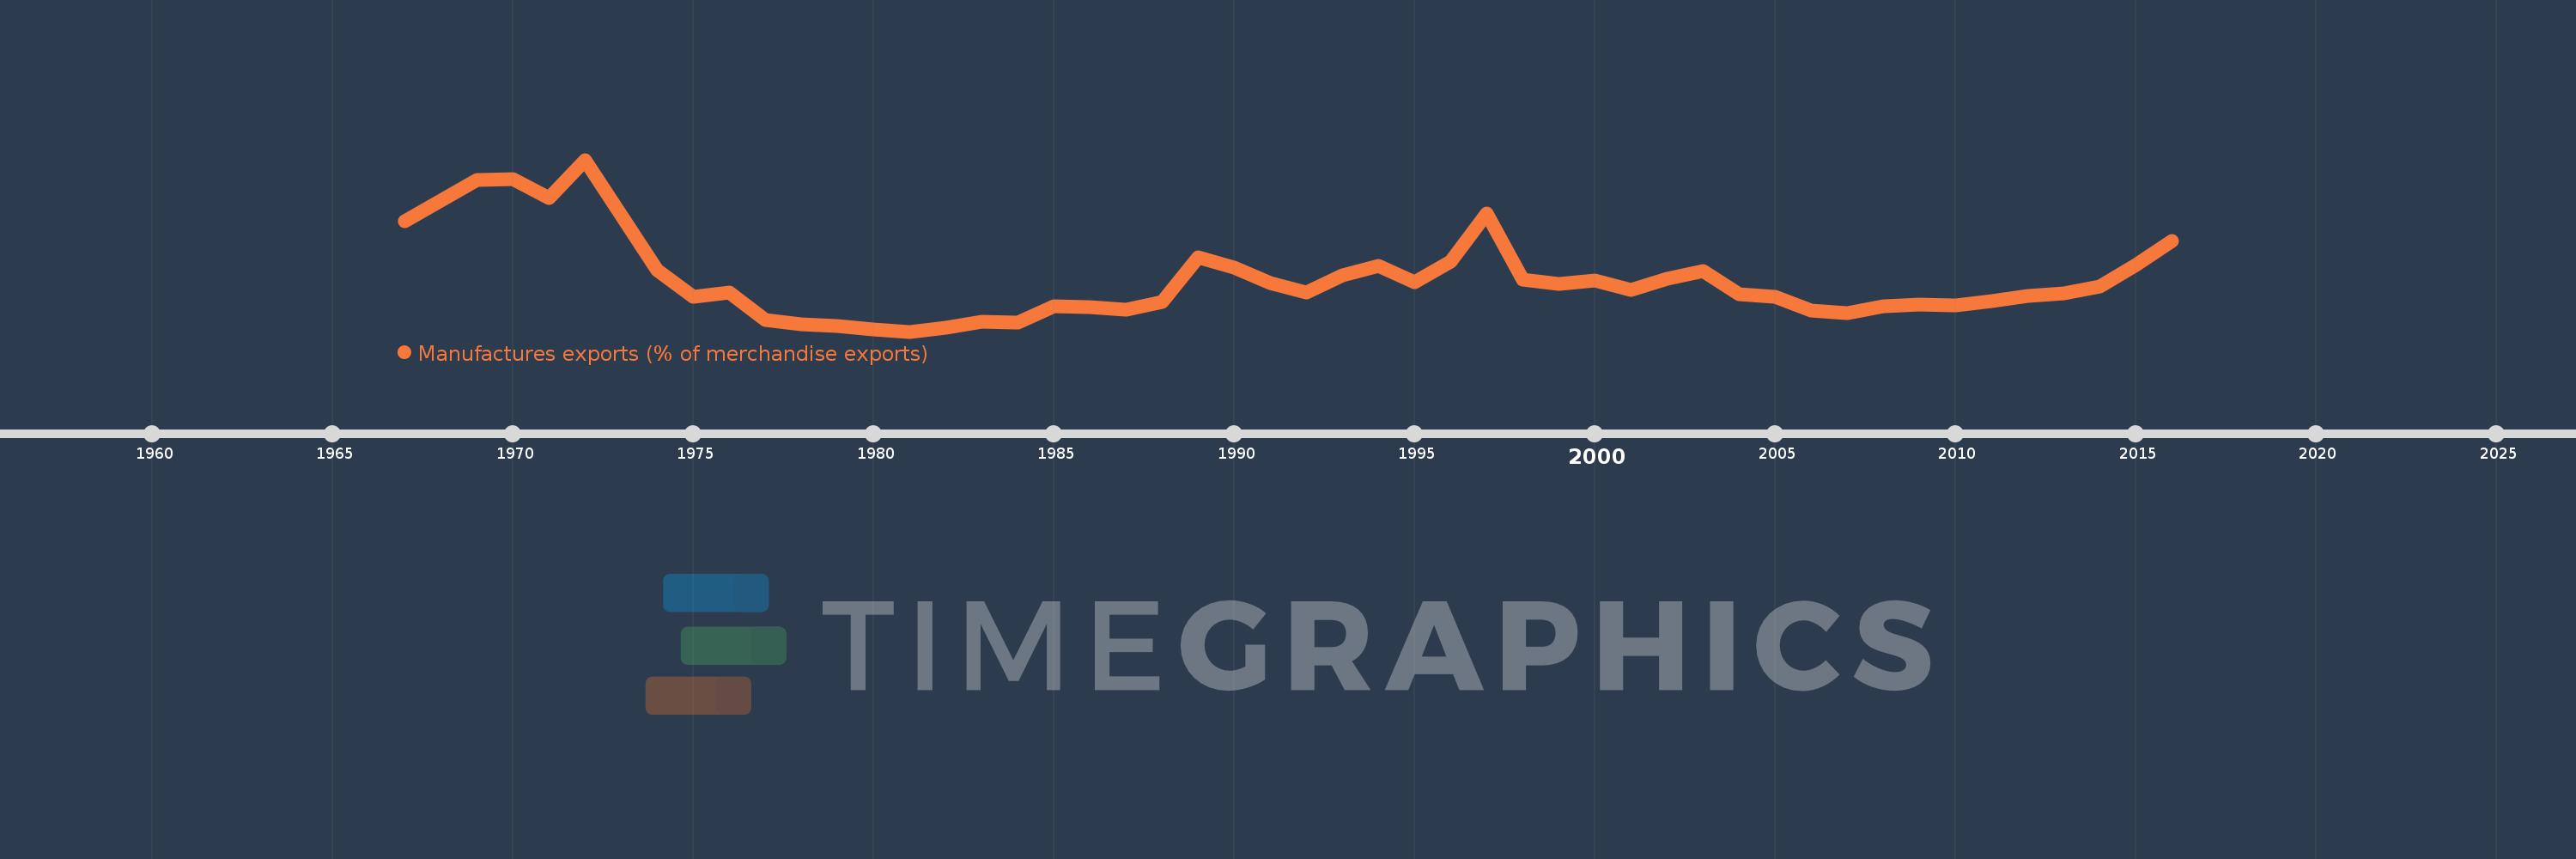
Manufactures exports (% of merchandise exports)
2016,2015,2014,2013,2012,2011,2010,2009,2008,2007,2006,2005,2004,2003,2002,2001,2000,1999,1998,1997,1996,1995,1994,1993,1992,1991,1990,1989,1988,1987,1986,1985,1984,1983,1982,1981,1980,1979,1978,1977,1976,1975,1974,1972,1971,1970,1969,1967
Estas estatísticas em outros países:
AfghanistanAlbaniaAlgeriaAndorraAngolaAntigua and BarbudaArab WorldArgentinaArmeniaArubaAustraliaAustriaAzerbaijanBahamas, TheBahrainBangladeshBarbadosBelarusBelgiumBelizeBeninBermudaBhutanBoliviaBosnia and HerzegovinaBotswanaBrazilBrunei DarussalamBulgariaBurkina FasoBurundiCabo VerdeCambodiaCameroonCanadaCaribbean small statesCayman IslandsCentral African RepublicCentral Europe and the BalticsChadChileChinaColombiaComorosCongo, Dem. Rep.Congo, Rep.Costa RicaCote d'IvoireCroatiaCubaCyprusCzech RepublicDenmarkDjiboutiDominicaDominican RepublicEarly-demographic dividendEast Asia & PacificEast Asia & Pacific (excluding high income)East Asia & Pacific (IDA & IBRD countries)EcuadorEgypt, Arab Rep.El SalvadorEquatorial GuineaEritreaEstoniaEthiopiaEuro areaEurope & Central AsiaEurope & Central Asia (excluding high income)Europe & Central Asia (IDA & IBRD countries)European UnionFaroe IslandsFijiFinlandFragile and conflict affected situationsFranceFrench PolynesiaGabonGambia, TheGeorgiaGermanyGhanaGreeceGreenlandGrenadaGuatemalaGuineaGuinea-BissauGuyanaHaitiHeavily indebted poor countries (HIPC)High incomeHondurasHong Kong SAR, ChinaHungaryIBRD onlyIcelandIDA & IBRD totalIDA blendIDA onlyIDA totalIndiaIndonesiaIran, Islamic Rep.IraqIrelandIsraelItalyJamaicaJapanJordanKazakhstanKenyaKiribatiKorea, Rep.KuwaitKyrgyz RepublicLao PDRLate-demographic dividendLatin America & Caribbean Latin America & Caribbean (excluding high income)Latin America & the Caribbean (IDA & IBRD countries)LatviaLeast developed countries: UN classificationLebanonLesothoLiberiaLibyaLithuaniaLow & middle incomeLower middle incomeLuxembourgMacao SAR, ChinaMacedonia, FYRMadagascarMalawiMalaysiaMaldivesMaliMaltaMauritaniaMauritiusMexicoMiddle East & North AfricaMiddle East & North Africa (excluding high income)Middle East & North Africa (IDA & IBRD countries)Middle incomeMoldovaMongoliaMoroccoMozambiqueMyanmarNamibiaNepalNetherlandsNew CaledoniaNew ZealandNicaraguaNigerNigeriaNorth AmericaNorwayOECD membersOmanOther small statesPacific island small statesPakistanPalauPanamaPapua New GuineaParaguayPeruPhilippinesPolandPortugalPost-demographic dividendPre-demographic dividendQatarRomaniaRussian FederationRwandaSamoaSao Tome and PrincipeSaudi ArabiaSenegalSerbiaSeychellesSierra LeoneSingaporeSlovak RepublicSloveniaSmall statesSolomon IslandsSomaliaSouth AfricaSouth AsiaSouth Asia (IDA & IBRD)SpainSri LankaSt. Kitts and NevisSt. LuciaSt. Vincent and the GrenadinesSub-Saharan Africa Sub-Saharan Africa (excluding high income)Sub-Saharan Africa (IDA & IBRD countries)SudanSurinameSwazilandSwedenSwitzerlandSyrian Arab RepublicTajikistanTanzaniaThailandTimor-LesteTogoTongaTrinidad and TobagoTunisiaTurkeyTurkmenistanTurks and Caicos IslandsTuvaluUgandaUkraineUnited Arab EmiratesUnited KingdomUnited StatesUpper middle incomeUruguayVanuatuVenezuela, RBVietnamVirgin Islands (U.S.)WorldYemen, Rep.ZambiaZimbabwe Linha do tempo:
Nesta escala de tempo está apresentado um gráfico de 1967 ano até 2016 ano Algeria. Dados de 1966 ano ausente. O número de observações reais por data: 48.
Fonte (nome):
Indicadores de desenvolvimento mundial
Fonte (organização):
World Bank staff estimates from the Comtrade database maintained by the United Nations Statistics Division.
Categorias:
Private Sector, Trade
Foi atualizado:
23 abr 2017 ano
Indicadores de alterações dos valores ao longo dos anos
Mínimo:
0.316
1 jan 1981 ano
Máximo:
8.566
1 jan 1972 ano
Na data de observação
Valor
Mudança absoluta
A alteração em relação ao valor anterior
1 jan 1967 ano
5.604
+5.604
0.0%
1 jan 1969 ano
7.586
+1.982
35.38%
1 jan 1970 ano
7.644
+0.058
0.77%
1 jan 1971 ano
6.741
-0.903
-11.81%
1 jan 1972 ano
8.566
+1.824
27.06%
1 jan 1974 ano
3.255
-5.31
-62.0%
1 jan 1975 ano
2.006
-1.249
-38.37%
1 jan 1976 ano
2.181
+0.175
8.7%
1 jan 1977 ano
0.877
-1.304
-59.79%
1 jan 1978 ano
0.657
-0.22
-25.11%
1 jan 1979 ano
0.566
-0.09
-13.75%
1 jan 1980 ano
0.4
-0.166
-29.32%
1 jan 1981 ano
0.316
-0.085
-21.17%
1 jan 1982 ano
0.505
+0.19
60.09%
1 jan 1983 ano
0.774
+0.269
53.21%
1 jan 1984 ano
0.734
-0.041
-5.24%
1 jan 1985 ano
1.547
+0.813
110.86%
1 jan 1986 ano
1.511
-0.036
-2.3%
1 jan 1987 ano
1.365
-0.146
-9.65%
1 jan 1988 ano
1.726
+0.36
26.4%
1 jan 1989 ano
3.898
+2.173
125.9%
1 jan 1990 ano
3.37
-0.529
-13.56%
1 jan 1991 ano
2.644
-0.725
-21.53%
1 jan 1992 ano
2.181
-0.464
-17.53%
1 jan 1993 ano
3.028
+0.847
38.86%
1 jan 1994 ano
3.468
+0.44
14.53%
1 jan 1995 ano
2.692
-0.775
-22.36%
1 jan 1996 ano
3.692
+1.0
37.14%
1 jan 1997 ano
5.977
+2.284
61.87%
1 jan 1998 ano
2.825
-3.152
-52.73%
1 jan 1999 ano
2.624
-0.201
-7.12%
1 jan 2000 ano
2.787
+0.163
6.22%
1 jan 2001 ano
2.312
-0.476
-17.07%
1 jan 2002 ano
2.871
+0.559
24.19%
1 jan 2003 ano
3.221
+0.35
12.19%
1 jan 2004 ano
2.119
-1.102
-34.22%
1 jan 2005 ano
2.003
-0.116
-5.47%
1 jan 2006 ano
1.324
-0.679
-33.92%
1 jan 2007 ano
1.202
-0.122
-9.19%
1 jan 2008 ano
1.534
+0.332
27.6%
1 jan 2009 ano
1.621
+0.088
5.72%
1 jan 2010 ano
1.563
-0.058
-3.6%
1 jan 2011 ano
1.786
+0.223
14.29%
1 jan 2012 ano
2.034
+0.248
13.88%
1 jan 2013 ano
2.164
+0.129
6.36%
1 jan 2014 ano
2.485
+0.321
14.84%
1 jan 2015 ano
3.498
+1.013
40.78%
1 jan 2016 ano
4.655
+1.157
33.08%
Classificação de países por estatísticas atuais por anos


Comentários: