29
/pt/
pt
AIzaSyAYiBZKx7MnpbEhh9jyipgxe19OcubqV5w
April 1, 2024
160719
Israel
ISR
true
2
1
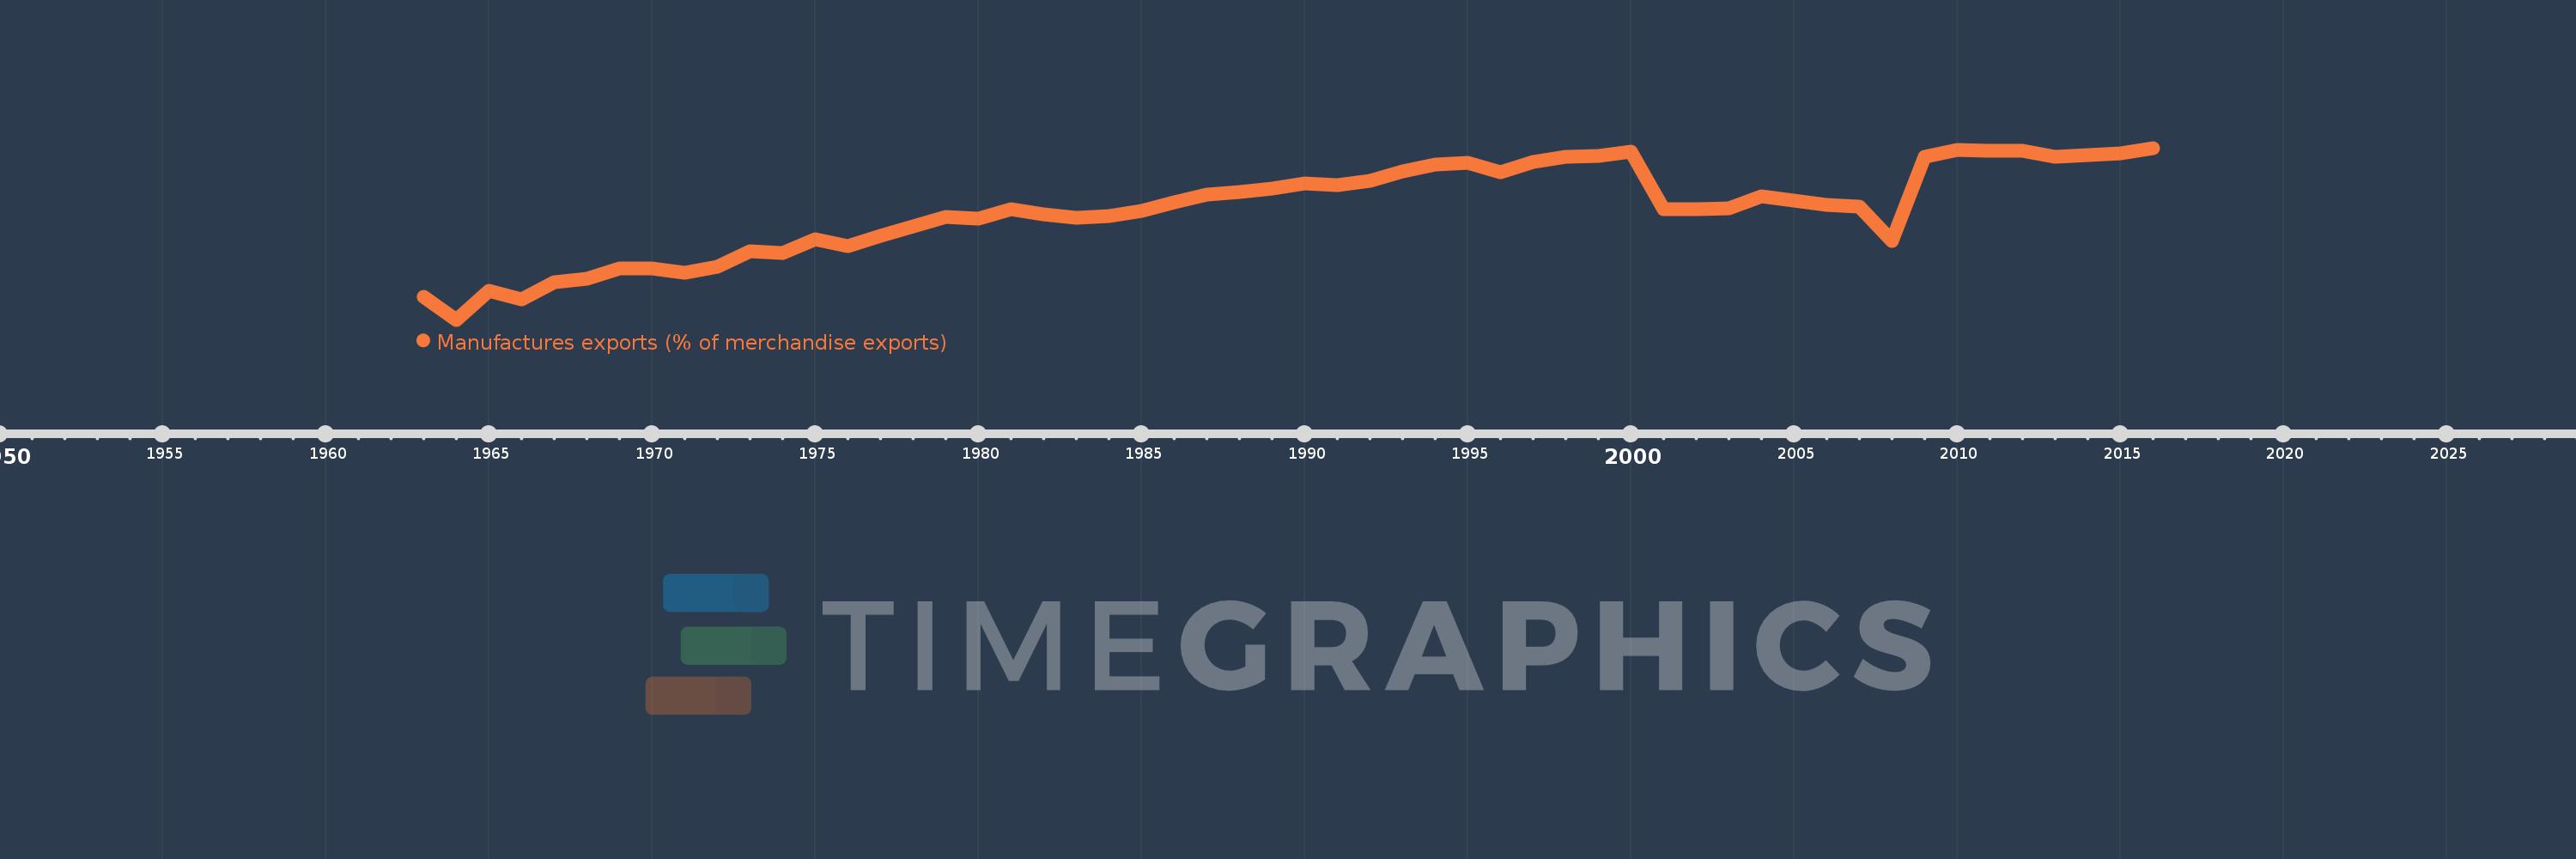
Manufactures exports (% of merchandise exports)
2016,2015,2014,2013,2012,2011,2010,2009,2008,2007,2006,2005,2004,2003,2002,2001,2000,1999,1998,1997,1996,1995,1994,1993,1992,1991,1990,1989,1988,1987,1986,1985,1984,1983,1982,1981,1980,1979,1978,1977,1976,1975,1974,1973,1972,1971,1970,1969,1968,1967,1966,1965,1964,1963
Estas estatísticas em outros países:
AfghanistanAlbaniaAlgeriaAndorraAngolaAntigua and BarbudaArab WorldArgentinaArmeniaArubaAustraliaAustriaAzerbaijanBahamas, TheBahrainBangladeshBarbadosBelarusBelgiumBelizeBeninBermudaBhutanBoliviaBosnia and HerzegovinaBotswanaBrazilBrunei DarussalamBulgariaBurkina FasoBurundiCabo VerdeCambodiaCameroonCanadaCaribbean small statesCayman IslandsCentral African RepublicCentral Europe and the BalticsChadChileChinaColombiaComorosCongo, Dem. Rep.Congo, Rep.Costa RicaCote d'IvoireCroatiaCubaCyprusCzech RepublicDenmarkDjiboutiDominicaDominican RepublicEarly-demographic dividendEast Asia & PacificEast Asia & Pacific (excluding high income)East Asia & Pacific (IDA & IBRD countries)EcuadorEgypt, Arab Rep.El SalvadorEquatorial GuineaEritreaEstoniaEthiopiaEuro areaEurope & Central AsiaEurope & Central Asia (excluding high income)Europe & Central Asia (IDA & IBRD countries)European UnionFaroe IslandsFijiFinlandFragile and conflict affected situationsFranceFrench PolynesiaGabonGambia, TheGeorgiaGermanyGhanaGreeceGreenlandGrenadaGuatemalaGuineaGuinea-BissauGuyanaHaitiHeavily indebted poor countries (HIPC)High incomeHondurasHong Kong SAR, ChinaHungaryIBRD onlyIcelandIDA & IBRD totalIDA blendIDA onlyIDA totalIndiaIndonesiaIran, Islamic Rep.IraqIrelandIsraelItalyJamaicaJapanJordanKazakhstanKenyaKiribatiKorea, Rep.KuwaitKyrgyz RepublicLao PDRLate-demographic dividendLatin America & Caribbean Latin America & Caribbean (excluding high income)Latin America & the Caribbean (IDA & IBRD countries)LatviaLeast developed countries: UN classificationLebanonLesothoLiberiaLibyaLithuaniaLow & middle incomeLower middle incomeLuxembourgMacao SAR, ChinaMacedonia, FYRMadagascarMalawiMalaysiaMaldivesMaliMaltaMauritaniaMauritiusMexicoMiddle East & North AfricaMiddle East & North Africa (excluding high income)Middle East & North Africa (IDA & IBRD countries)Middle incomeMoldovaMongoliaMoroccoMozambiqueMyanmarNamibiaNepalNetherlandsNew CaledoniaNew ZealandNicaraguaNigerNigeriaNorth AmericaNorwayOECD membersOmanOther small statesPacific island small statesPakistanPalauPanamaPapua New GuineaParaguayPeruPhilippinesPolandPortugalPost-demographic dividendPre-demographic dividendQatarRomaniaRussian FederationRwandaSamoaSao Tome and PrincipeSaudi ArabiaSenegalSerbiaSeychellesSierra LeoneSingaporeSlovak RepublicSloveniaSmall statesSolomon IslandsSomaliaSouth AfricaSouth AsiaSouth Asia (IDA & IBRD)SpainSri LankaSt. Kitts and NevisSt. LuciaSt. Vincent and the GrenadinesSub-Saharan Africa Sub-Saharan Africa (excluding high income)Sub-Saharan Africa (IDA & IBRD countries)SudanSurinameSwazilandSwedenSwitzerlandSyrian Arab RepublicTajikistanTanzaniaThailandTimor-LesteTogoTongaTrinidad and TobagoTunisiaTurkeyTurkmenistanTurks and Caicos IslandsTuvaluUgandaUkraineUnited Arab EmiratesUnited KingdomUnited StatesUpper middle incomeUruguayVanuatuVenezuela, RBVietnamVirgin Islands (U.S.)WorldYemen, Rep.ZambiaZimbabwe Linha do tempo:
Nesta escala de tempo está apresentado um gráfico de 1963 ano até 2016 ano Israel. Dados de 1962 ano ausente. O número de observações reais por data: 54.
Fonte (nome):
Indicadores de desenvolvimento mundial
Fonte (organização):
World Bank staff estimates from the Comtrade database maintained by the United Nations Statistics Division.
Categorias:
Private Sector, Trade
Foi atualizado:
23 abr 2017 ano
Indicadores de alterações dos valores ao longo dos anos
Mínimo:
60.483
1 jan 1964 ano
Máximo:
93.887
1 jan 2016 ano
Na data de observação
Valor
Mudança absoluta
A alteração em relação ao valor anterior
1 jan 1963 ano
64.863
+64.863
0.0%
1 jan 1964 ano
60.483
-4.38
-6.75%
1 jan 1965 ano
66.161
+5.677
9.39%
1 jan 1966 ano
64.389
-1.771
-2.68%
1 jan 1967 ano
67.756
+3.366
5.23%
1 jan 1968 ano
68.525
+0.769
1.14%
1 jan 1969 ano
70.508
+1.983
2.89%
1 jan 1970 ano
70.518
+0.01
0.01%
1 jan 1971 ano
69.621
-0.897
-1.27%
1 jan 1972 ano
70.745
+1.124
1.61%
1 jan 1973 ano
73.732
+2.987
4.22%
1 jan 1974 ano
73.49
-0.241
-0.33%
1 jan 1975 ano
76.069
+2.578
3.51%
1 jan 1976 ano
74.843
-1.226
-1.61%
1 jan 1977 ano
76.774
+1.932
2.58%
1 jan 1978 ano
78.647
+1.873
2.44%
1 jan 1979 ano
80.393
+1.746
2.22%
1 jan 1980 ano
80.159
-0.234
-0.29%
1 jan 1981 ano
81.946
+1.787
2.23%
1 jan 1982 ano
81.008
-0.939
-1.15%
1 jan 1983 ano
80.368
-0.639
-0.79%
1 jan 1984 ano
80.597
+0.229
0.29%
1 jan 1985 ano
81.599
+1.002
1.24%
1 jan 1986 ano
83.267
+1.668
2.04%
1 jan 1987 ano
84.791
+1.524
1.83%
1 jan 1988 ano
85.369
+0.578
0.68%
1 jan 1989 ano
85.988
+0.619
0.72%
1 jan 1990 ano
87.02
+1.032
1.2%
1 jan 1991 ano
86.607
-0.413
-0.47%
1 jan 1992 ano
87.495
+0.888
1.03%
1 jan 1993 ano
89.272
+1.777
2.03%
1 jan 1994 ano
90.582
+1.31
1.47%
1 jan 1995 ano
91.076
+0.495
0.55%
1 jan 1996 ano
89.126
-1.951
-2.14%
1 jan 1997 ano
91.132
+2.006
2.25%
1 jan 1998 ano
92.117
+0.986
1.08%
1 jan 1999 ano
92.356
+0.239
0.26%
1 jan 2000 ano
93.154
+0.798
0.86%
1 jan 2001 ano
81.929
-11.225
-12.05%
1 jan 2002 ano
81.947
+0.018
0.02%
1 jan 2003 ano
82.222
+0.276
0.34%
1 jan 2004 ano
84.545
+2.323
2.82%
1 jan 2005 ano
83.622
-0.923
-1.09%
1 jan 2006 ano
82.861
-0.762
-0.91%
1 jan 2007 ano
82.452
-0.409
-0.49%
1 jan 2008 ano
75.856
-6.596
-8.0%
1 jan 2009 ano
92.135
+16.279
21.46%
1 jan 2010 ano
93.544
+1.409
1.53%
1 jan 2011 ano
93.335
-0.209
-0.22%
1 jan 2012 ano
93.302
-0.033
-0.04%
1 jan 2013 ano
92.219
-1.083
-1.16%
1 jan 2014 ano
92.513
+0.294
0.32%
1 jan 2015 ano
92.777
+0.265
0.29%
1 jan 2016 ano
93.887
+1.11
1.2%
Classificação de países por estatísticas atuais por anos


Comentários: