29
/pt/
pt
AIzaSyAYiBZKx7MnpbEhh9jyipgxe19OcubqV5w
April 1, 2024
190491
Mali
MLI
true
2
1
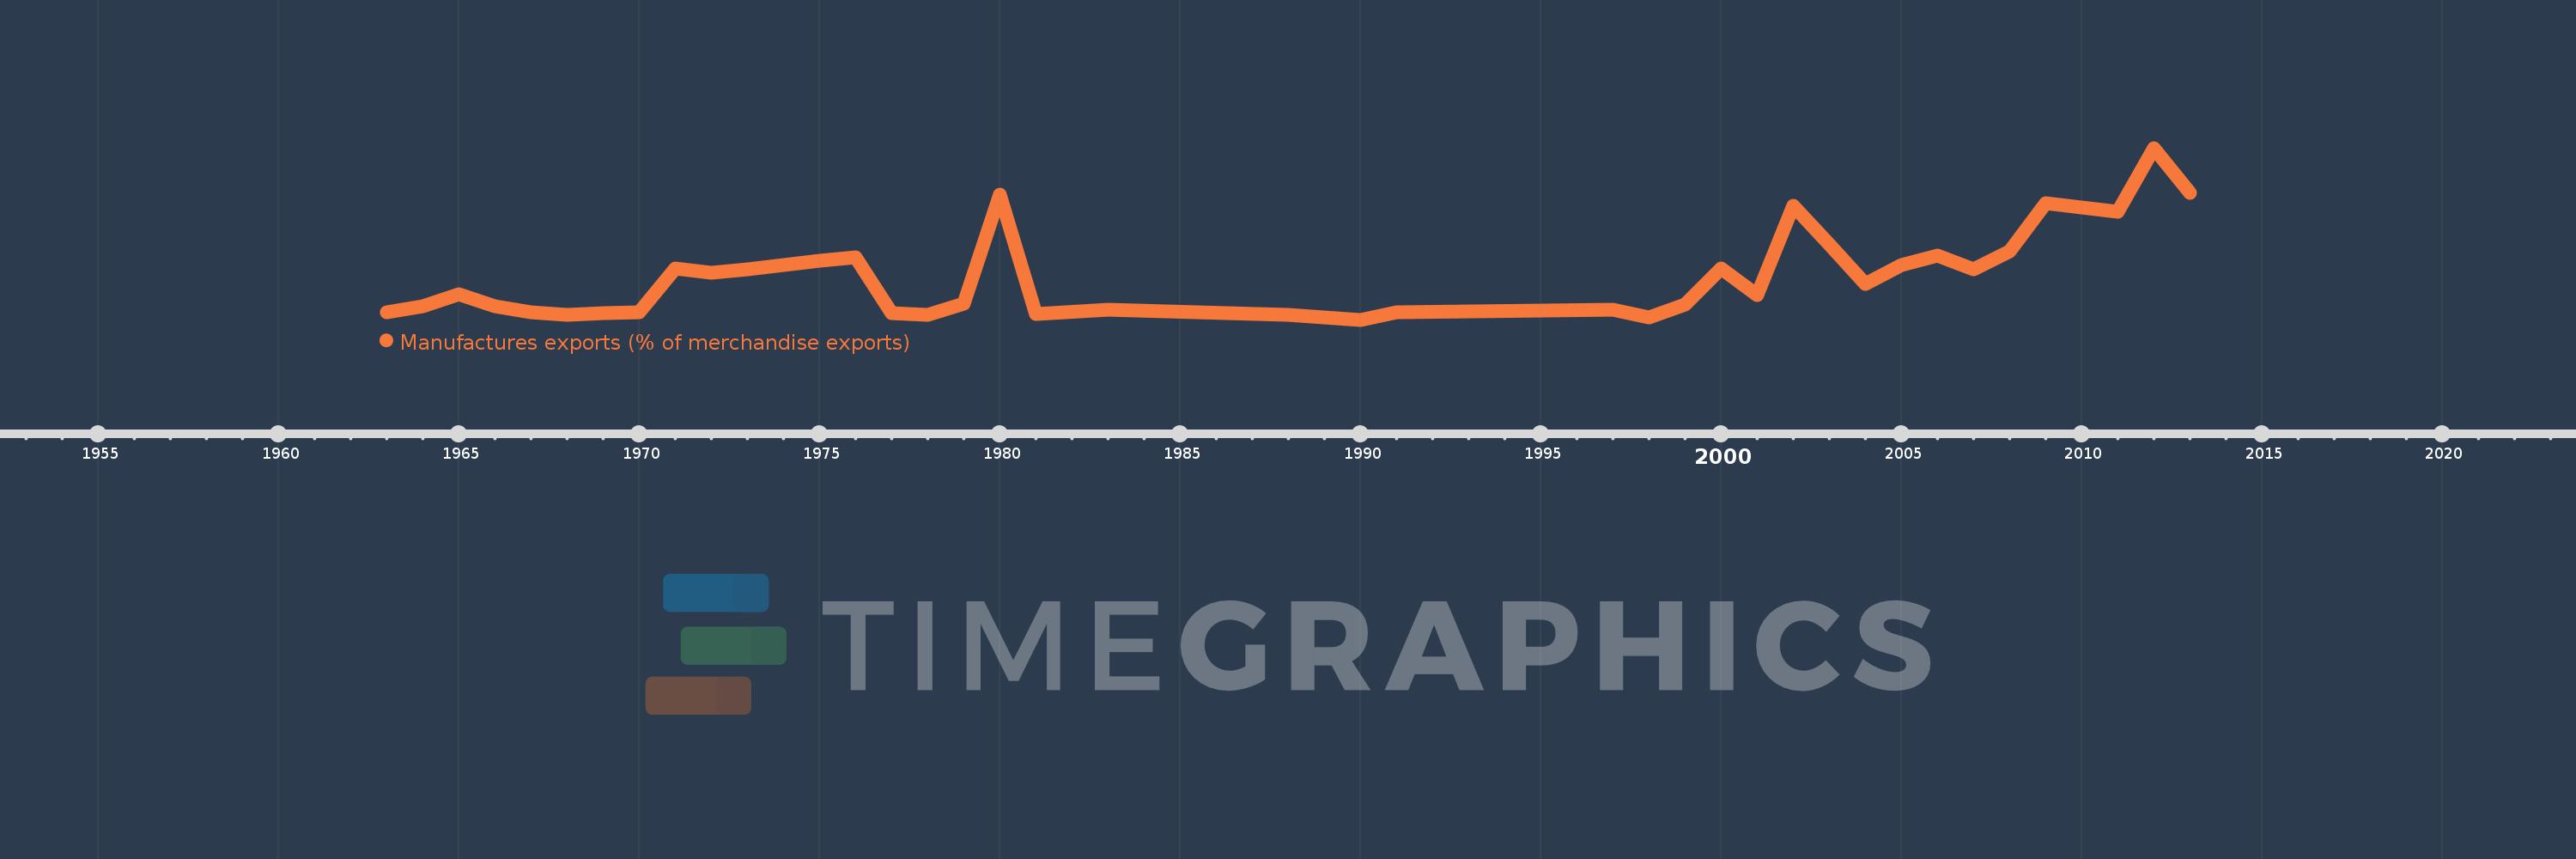
Manufactures exports (% of merchandise exports)
2013,2012,2011,2009,2008,2007,2006,2005,2004,2003,2002,2001,2000,1999,1998,1997,1991,1990,1988,1983,1981,1980,1979,1978,1977,1976,1975,1973,1972,1971,1970,1969,1968,1967,1966,1965,1964,1963
Estas estatísticas em outros países:
AfghanistanAlbaniaAlgeriaAndorraAngolaAntigua and BarbudaArab WorldArgentinaArmeniaArubaAustraliaAustriaAzerbaijanBahamas, TheBahrainBangladeshBarbadosBelarusBelgiumBelizeBeninBermudaBhutanBoliviaBosnia and HerzegovinaBotswanaBrazilBrunei DarussalamBulgariaBurkina FasoBurundiCabo VerdeCambodiaCameroonCanadaCaribbean small statesCayman IslandsCentral African RepublicCentral Europe and the BalticsChadChileChinaColombiaComorosCongo, Dem. Rep.Congo, Rep.Costa RicaCote d'IvoireCroatiaCubaCyprusCzech RepublicDenmarkDjiboutiDominicaDominican RepublicEarly-demographic dividendEast Asia & PacificEast Asia & Pacific (excluding high income)East Asia & Pacific (IDA & IBRD countries)EcuadorEgypt, Arab Rep.El SalvadorEquatorial GuineaEritreaEstoniaEthiopiaEuro areaEurope & Central AsiaEurope & Central Asia (excluding high income)Europe & Central Asia (IDA & IBRD countries)European UnionFaroe IslandsFijiFinlandFragile and conflict affected situationsFranceFrench PolynesiaGabonGambia, TheGeorgiaGermanyGhanaGreeceGreenlandGrenadaGuatemalaGuineaGuinea-BissauGuyanaHaitiHeavily indebted poor countries (HIPC)High incomeHondurasHong Kong SAR, ChinaHungaryIBRD onlyIcelandIDA & IBRD totalIDA blendIDA onlyIDA totalIndiaIndonesiaIran, Islamic Rep.IraqIrelandIsraelItalyJamaicaJapanJordanKazakhstanKenyaKiribatiKorea, Rep.KuwaitKyrgyz RepublicLao PDRLate-demographic dividendLatin America & Caribbean Latin America & Caribbean (excluding high income)Latin America & the Caribbean (IDA & IBRD countries)LatviaLeast developed countries: UN classificationLebanonLesothoLiberiaLibyaLithuaniaLow & middle incomeLower middle incomeLuxembourgMacao SAR, ChinaMacedonia, FYRMadagascarMalawiMalaysiaMaldivesMaliMaltaMauritaniaMauritiusMexicoMiddle East & North AfricaMiddle East & North Africa (excluding high income)Middle East & North Africa (IDA & IBRD countries)Middle incomeMoldovaMongoliaMoroccoMozambiqueMyanmarNamibiaNepalNetherlandsNew CaledoniaNew ZealandNicaraguaNigerNigeriaNorth AmericaNorwayOECD membersOmanOther small statesPacific island small statesPakistanPalauPanamaPapua New GuineaParaguayPeruPhilippinesPolandPortugalPost-demographic dividendPre-demographic dividendQatarRomaniaRussian FederationRwandaSamoaSao Tome and PrincipeSaudi ArabiaSenegalSerbiaSeychellesSierra LeoneSingaporeSlovak RepublicSloveniaSmall statesSolomon IslandsSomaliaSouth AfricaSouth AsiaSouth Asia (IDA & IBRD)SpainSri LankaSt. Kitts and NevisSt. LuciaSt. Vincent and the GrenadinesSub-Saharan Africa Sub-Saharan Africa (excluding high income)Sub-Saharan Africa (IDA & IBRD countries)SudanSurinameSwazilandSwedenSwitzerlandSyrian Arab RepublicTajikistanTanzaniaThailandTimor-LesteTogoTongaTrinidad and TobagoTunisiaTurkeyTurkmenistanTurks and Caicos IslandsTuvaluUgandaUkraineUnited Arab EmiratesUnited KingdomUnited StatesUpper middle incomeUruguayVanuatuVenezuela, RBVietnamVirgin Islands (U.S.)WorldYemen, Rep.ZambiaZimbabwe Linha do tempo:
Nesta escala de tempo está apresentado um gráfico de 1963 ano até 2013 ano Mali. Dados de 1962 ano ausente. O número de observações reais por data: 38.
Fonte (nome):
Indicadores de desenvolvimento mundial
Fonte (organização):
World Bank staff estimates from the Comtrade database maintained by the United Nations Statistics Division.
Categorias:
Private Sector, Trade
Foi atualizado:
23 abr 2017 ano
Indicadores de alterações dos valores ao longo dos anos
Mínimo:
0.21
1 jan 1990 ano
Máximo:
31.929
1 jan 2012 ano
Na data de observação
Valor
Mudança absoluta
A alteração em relação ao valor anterior
1 jan 1963 ano
1.563
+1.563
0.0%
1 jan 1964 ano
2.624
+1.061
67.88%
1 jan 1965 ano
4.954
+2.329
88.76%
1 jan 1966 ano
2.63
-2.323
-46.9%
1 jan 1967 ano
1.568
-1.063
-40.39%
1 jan 1968 ano
1.131
-0.437
-27.86%
1 jan 1969 ano
1.5
+0.369
32.61%
1 jan 1970 ano
1.606
+0.107
7.11%
1 jan 1971 ano
9.644
+8.038
500.33%
1 jan 1972 ano
8.93
-0.715
-7.41%
1 jan 1973 ano
9.499
+0.57
6.38%
1 jan 1975 ano
11.078
+1.579
16.62%
1 jan 1976 ano
11.676
+0.598
5.4%
1 jan 1977 ano
1.396
-10.28
-88.04%
1 jan 1978 ano
1.072
-0.324
-23.2%
1 jan 1979 ano
3.227
+2.154
200.95%
1 jan 1980 ano
23.374
+20.147
624.41%
1 jan 1981 ano
1.27
-22.104
-94.57%
1 jan 1983 ano
2.028
+0.758
59.72%
1 jan 1988 ano
1.08
-0.948
-46.74%
1 jan 1990 ano
0.21
-0.87
-80.57%
1 jan 1991 ano
1.56
+1.35
643.13%
1 jan 1997 ano
2.123
+0.563
36.1%
1 jan 1998 ano
0.714
-1.409
-66.39%
1 jan 1999 ano
3.018
+2.305
323.0%
1 jan 2000 ano
9.726
+6.708
222.23%
1 jan 2001 ano
4.727
-4.999
-51.4%
1 jan 2002 ano
21.246
+16.519
349.47%
1 jan 2003 ano
14.084
-7.162
-33.71%
1 jan 2004 ano
6.887
-7.196
-51.1%
1 jan 2005 ano
10.38
+3.492
50.71%
1 jan 2006 ano
12.032
+1.652
15.92%
1 jan 2007 ano
9.446
-2.586
-21.49%
1 jan 2008 ano
12.83
+3.384
35.83%
1 jan 2009 ano
21.786
+8.956
69.81%
1 jan 2011 ano
20.195
-1.591
-7.3%
1 jan 2012 ano
31.929
+11.734
58.11%
1 jan 2013 ano
23.556
-8.373
-26.22%
Classificação de países por estatísticas atuais por anos


Comentários: