29
/pt/
pt
AIzaSyAYiBZKx7MnpbEhh9jyipgxe19OcubqV5w
April 1, 2024
85296
Bermuda
BMU
true
2
1
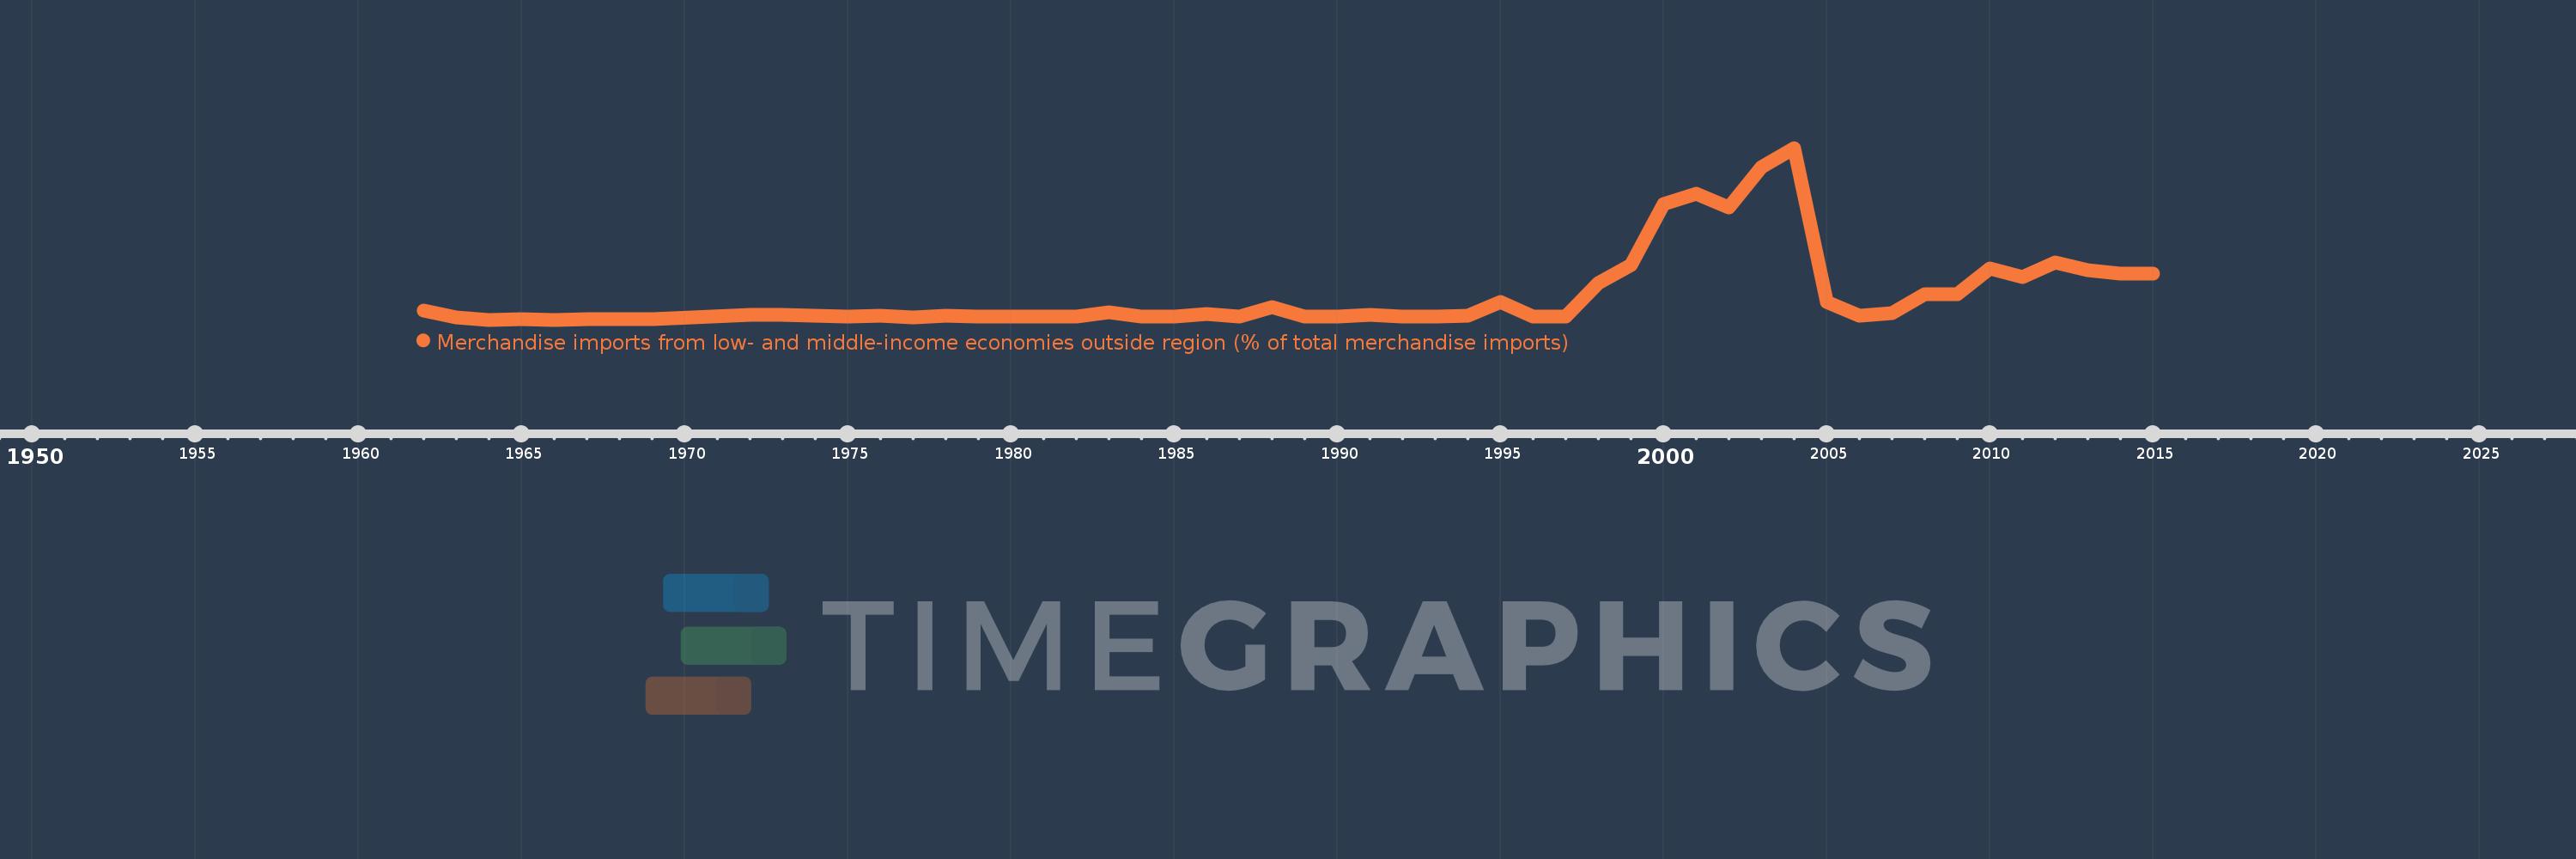
Merchandise imports from low- and middle-income economies outside region (% of total merchandise imports)
2015,2014,2013,2012,2011,2010,2009,2008,2007,2006,2005,2004,2003,2002,2001,2000,1999,1998,1997,1996,1995,1994,1993,1992,1991,1990,1989,1988,1987,1986,1985,1984,1983,1982,1981,1980,1979,1978,1977,1976,1975,1974,1973,1972,1969,1968,1967,1966,1965,1964,1963,1962
Estas estatísticas em outros países:
AfghanistanAlbaniaAlgeriaAngolaArab WorldArgentinaArmeniaArubaAustraliaAustriaAzerbaijanBahamas, TheBahrainBangladeshBarbadosBelarusBelgiumBelizeBeninBermudaBoliviaBrazilBrunei DarussalamBulgariaBurkina FasoBurundiCabo VerdeCambodiaCameroonCanadaCaribbean small statesCentral African RepublicCentral Europe and the BalticsChileChinaColombiaCongo, Dem. Rep.Congo, Rep.Costa RicaCote d'IvoireCroatiaCubaCyprusCzech RepublicDenmarkDominicaDominican RepublicEarly-demographic dividendEast Asia & PacificEast Asia & Pacific (excluding high income)East Asia & Pacific (IDA & IBRD countries)EcuadorEgypt, Arab Rep.El SalvadorEstoniaEthiopiaEuro areaEurope & Central AsiaEurope & Central Asia (excluding high income)Europe & Central Asia (IDA & IBRD countries)European UnionFijiFinlandFragile and conflict affected situationsFranceGabonGambia, TheGeorgiaGermanyGhanaGreeceGreenlandGrenadaGuatemalaGuineaGuyanaHaitiHeavily indebted poor countries (HIPC)High incomeHondurasHong Kong SAR, ChinaHungaryIBRD onlyIcelandIDA & IBRD totalIDA blendIDA onlyIDA totalIndiaIndonesiaIran, Islamic Rep.IraqIrelandIsraelItalyJamaicaJapanJordanKazakhstanKenyaKorea, Dem. People’s Rep.Korea, Rep.KuwaitKyrgyz RepublicLao PDRLate-demographic dividendLatin America & Caribbean Latin America & Caribbean (excluding high income)Latin America & the Caribbean (IDA & IBRD countries)LatviaLeast developed countries: UN classificationLebanonLiberiaLibyaLithuaniaLow & middle incomeLow incomeLower middle incomeLuxembourgMacao SAR, ChinaMacedonia, FYRMadagascarMalawiMalaysiaMaliMaltaMauritaniaMauritiusMexicoMiddle East & North AfricaMiddle East & North Africa (excluding high income)Middle East & North Africa (IDA & IBRD countries)Middle incomeMoldovaMongoliaMontenegroMoroccoMozambiqueMyanmarNetherlandsNew CaledoniaNew ZealandNicaraguaNigerNigeriaNorth AmericaNorwayOECD membersOmanOther small statesPacific island small statesPakistanPanamaPapua New GuineaParaguayPeruPhilippinesPolandPortugalPost-demographic dividendPre-demographic dividendQatarRomaniaRussian FederationRwandaSaudi ArabiaSenegalSerbiaSeychellesSierra LeoneSingaporeSlovak RepublicSloveniaSmall statesSomaliaSouth AfricaSouth AsiaSouth Asia (IDA & IBRD)SpainSri LankaSt. Kitts and NevisSt. LuciaSt. Vincent and the GrenadinesSub-Saharan Africa Sub-Saharan Africa (excluding high income)Sub-Saharan Africa (IDA & IBRD countries)SudanSurinameSwedenSwitzerlandSyrian Arab RepublicTanzaniaThailandTogoTrinidad and TobagoTunisiaTurkeyUgandaUkraineUnited Arab EmiratesUnited KingdomUnited StatesUpper middle incomeUruguayVenezuela, RBVietnamWorldYemen, Rep.ZambiaZimbabwe Linha do tempo:
Nesta escala de tempo está apresentado um gráfico de 1962 ano até 2015 ano Bermuda. Dados de 1961 ano ausente. O número de observações reais por data: 52.
Fonte (nome):
Indicadores de desenvolvimento mundial
Fonte (organização):
World Bank staff estimates based data from International Monetary Fund's Direction of Trade database.
Categorias:
Private Sector, Trade
Foi atualizado:
23 abr 2017 ano
Indicadores de alterações dos valores ao longo dos anos
Mínimo:
0.196
1 jan 1966 ano
Máximo:
48.598
1 jan 2004 ano
Na data de observação
Valor
Mudança absoluta
A alteração em relação ao valor anterior
1 jan 1962 ano
2.813
+2.813
0.0%
1 jan 1963 ano
0.884
-1.929
-68.59%
1 jan 1964 ano
0.24
-0.644
-72.83%
1 jan 1965 ano
0.46
+0.22
91.71%
1 jan 1966 ano
0.196
-0.264
-57.36%
1 jan 1967 ano
0.28
+0.084
42.72%
1 jan 1968 ano
0.262
-0.018
-6.38%
1 jan 1969 ano
0.413
+0.15
57.36%
1 jan 1972 ano
1.672
+1.259
305.18%
1 jan 1973 ano
1.642
-0.03
-1.81%
1 jan 1974 ano
1.449
-0.192
-11.72%
1 jan 1975 ano
1.039
-0.41
-28.32%
1 jan 1976 ano
1.333
+0.294
28.33%
1 jan 1977 ano
0.943
-0.391
-29.3%
1 jan 1978 ano
1.23
+0.288
30.54%
1 jan 1979 ano
1.001
-0.229
-18.64%
1 jan 1980 ano
1.022
+0.021
2.11%
1 jan 1981 ano
0.992
-0.031
-2.99%
1 jan 1982 ano
1.067
+0.076
7.66%
1 jan 1983 ano
2.371
+1.304
122.13%
1 jan 1984 ano
1.064
-1.307
-55.14%
1 jan 1985 ano
1.003
-0.061
-5.69%
1 jan 1986 ano
1.748
+0.745
74.28%
1 jan 1987 ano
1.003
-0.745
-42.62%
1 jan 1988 ano
3.839
+2.835
282.64%
1 jan 1989 ano
1.122
-2.716
-70.76%
1 jan 1990 ano
1.015
-0.108
-9.58%
1 jan 1991 ano
1.582
+0.567
55.89%
1 jan 1992 ano
1.121
-0.461
-29.15%
1 jan 1993 ano
1.05
-0.071
-6.35%
1 jan 1994 ano
1.28
+0.23
21.92%
1 jan 1995 ano
5.222
+3.942
307.97%
1 jan 1996 ano
1.117
-4.105
-78.62%
1 jan 1997 ano
1.111
-0.005
-0.47%
1 jan 1998 ano
10.441
+9.329
839.33%
1 jan 1999 ano
15.636
+5.196
49.76%
1 jan 2000 ano
32.908
+17.272
110.46%
1 jan 2001 ano
35.651
+2.743
8.34%
1 jan 2002 ano
31.76
-3.891
-10.91%
1 jan 2003 ano
43.098
+11.338
35.7%
1 jan 2004 ano
48.598
+5.5
12.76%
1 jan 2005 ano
5.194
-43.405
-89.31%
1 jan 2006 ano
1.326
-3.867
-74.46%
1 jan 2007 ano
2.023
+0.696
52.5%
1 jan 2008 ano
7.324
+5.301
262.1%
1 jan 2009 ano
7.315
-0.009
-0.12%
1 jan 2010 ano
14.721
+7.406
101.24%
1 jan 2011 ano
12.195
-2.526
-17.16%
1 jan 2012 ano
16.262
+4.067
33.35%
1 jan 2013 ano
14.129
-2.133
-13.12%
1 jan 2014 ano
13.104
-1.026
-7.26%
1 jan 2015 ano
13.284
+0.181
1.38%
Classificação de países por estatísticas atuais por anos


Comentários: