29
/pt/
pt
AIzaSyAYiBZKx7MnpbEhh9jyipgxe19OcubqV5w
April 1, 2024
211990
Niger
NER
true
2
1
Merchandise imports from low- and middle-income economies outside region (% of total merchandise imports)
2015,2014,2013,2012,2011,2010,2009,2008,2007,2006,2005,2004,2003,2002,2001,2000,1999,1998,1997,1996,1995,1994,1993,1992,1991,1990,1989,1988,1987
Estas estatísticas em outros países:
AfghanistanAlbaniaAlgeriaAngolaArab WorldArgentinaArmeniaArubaAustraliaAustriaAzerbaijanBahamas, TheBahrainBangladeshBarbadosBelarusBelgiumBelizeBeninBermudaBoliviaBrazilBrunei DarussalamBulgariaBurkina FasoBurundiCabo VerdeCambodiaCameroonCanadaCaribbean small statesCentral African RepublicCentral Europe and the BalticsChileChinaColombiaCongo, Dem. Rep.Congo, Rep.Costa RicaCote d'IvoireCroatiaCubaCyprusCzech RepublicDenmarkDominicaDominican RepublicEarly-demographic dividendEast Asia & PacificEast Asia & Pacific (excluding high income)East Asia & Pacific (IDA & IBRD countries)EcuadorEgypt, Arab Rep.El SalvadorEstoniaEthiopiaEuro areaEurope & Central AsiaEurope & Central Asia (excluding high income)Europe & Central Asia (IDA & IBRD countries)European UnionFijiFinlandFragile and conflict affected situationsFranceGabonGambia, TheGeorgiaGermanyGhanaGreeceGreenlandGrenadaGuatemalaGuineaGuyanaHaitiHeavily indebted poor countries (HIPC)High incomeHondurasHong Kong SAR, ChinaHungaryIBRD onlyIcelandIDA & IBRD totalIDA blendIDA onlyIDA totalIndiaIndonesiaIran, Islamic Rep.IraqIrelandIsraelItalyJamaicaJapanJordanKazakhstanKenyaKorea, Dem. People’s Rep.Korea, Rep.KuwaitKyrgyz RepublicLao PDRLate-demographic dividendLatin America & Caribbean Latin America & Caribbean (excluding high income)Latin America & the Caribbean (IDA & IBRD countries)LatviaLeast developed countries: UN classificationLebanonLiberiaLibyaLithuaniaLow & middle incomeLow incomeLower middle incomeLuxembourgMacao SAR, ChinaMacedonia, FYRMadagascarMalawiMalaysiaMaliMaltaMauritaniaMauritiusMexicoMiddle East & North AfricaMiddle East & North Africa (excluding high income)Middle East & North Africa (IDA & IBRD countries)Middle incomeMoldovaMongoliaMontenegroMoroccoMozambiqueMyanmarNetherlandsNew CaledoniaNew ZealandNicaraguaNigerNigeriaNorth AmericaNorwayOECD membersOmanOther small statesPacific island small statesPakistanPanamaPapua New GuineaParaguayPeruPhilippinesPolandPortugalPost-demographic dividendPre-demographic dividendQatarRomaniaRussian FederationRwandaSaudi ArabiaSenegalSerbiaSeychellesSierra LeoneSingaporeSlovak RepublicSloveniaSmall statesSomaliaSouth AfricaSouth AsiaSouth Asia (IDA & IBRD)SpainSri LankaSt. Kitts and NevisSt. LuciaSt. Vincent and the GrenadinesSub-Saharan Africa Sub-Saharan Africa (excluding high income)Sub-Saharan Africa (IDA & IBRD countries)SudanSurinameSwedenSwitzerlandSyrian Arab RepublicTanzaniaThailandTogoTrinidad and TobagoTunisiaTurkeyUgandaUkraineUnited Arab EmiratesUnited KingdomUnited StatesUpper middle incomeUruguayVenezuela, RBVietnamWorldYemen, Rep.ZambiaZimbabwe Linha do tempo:
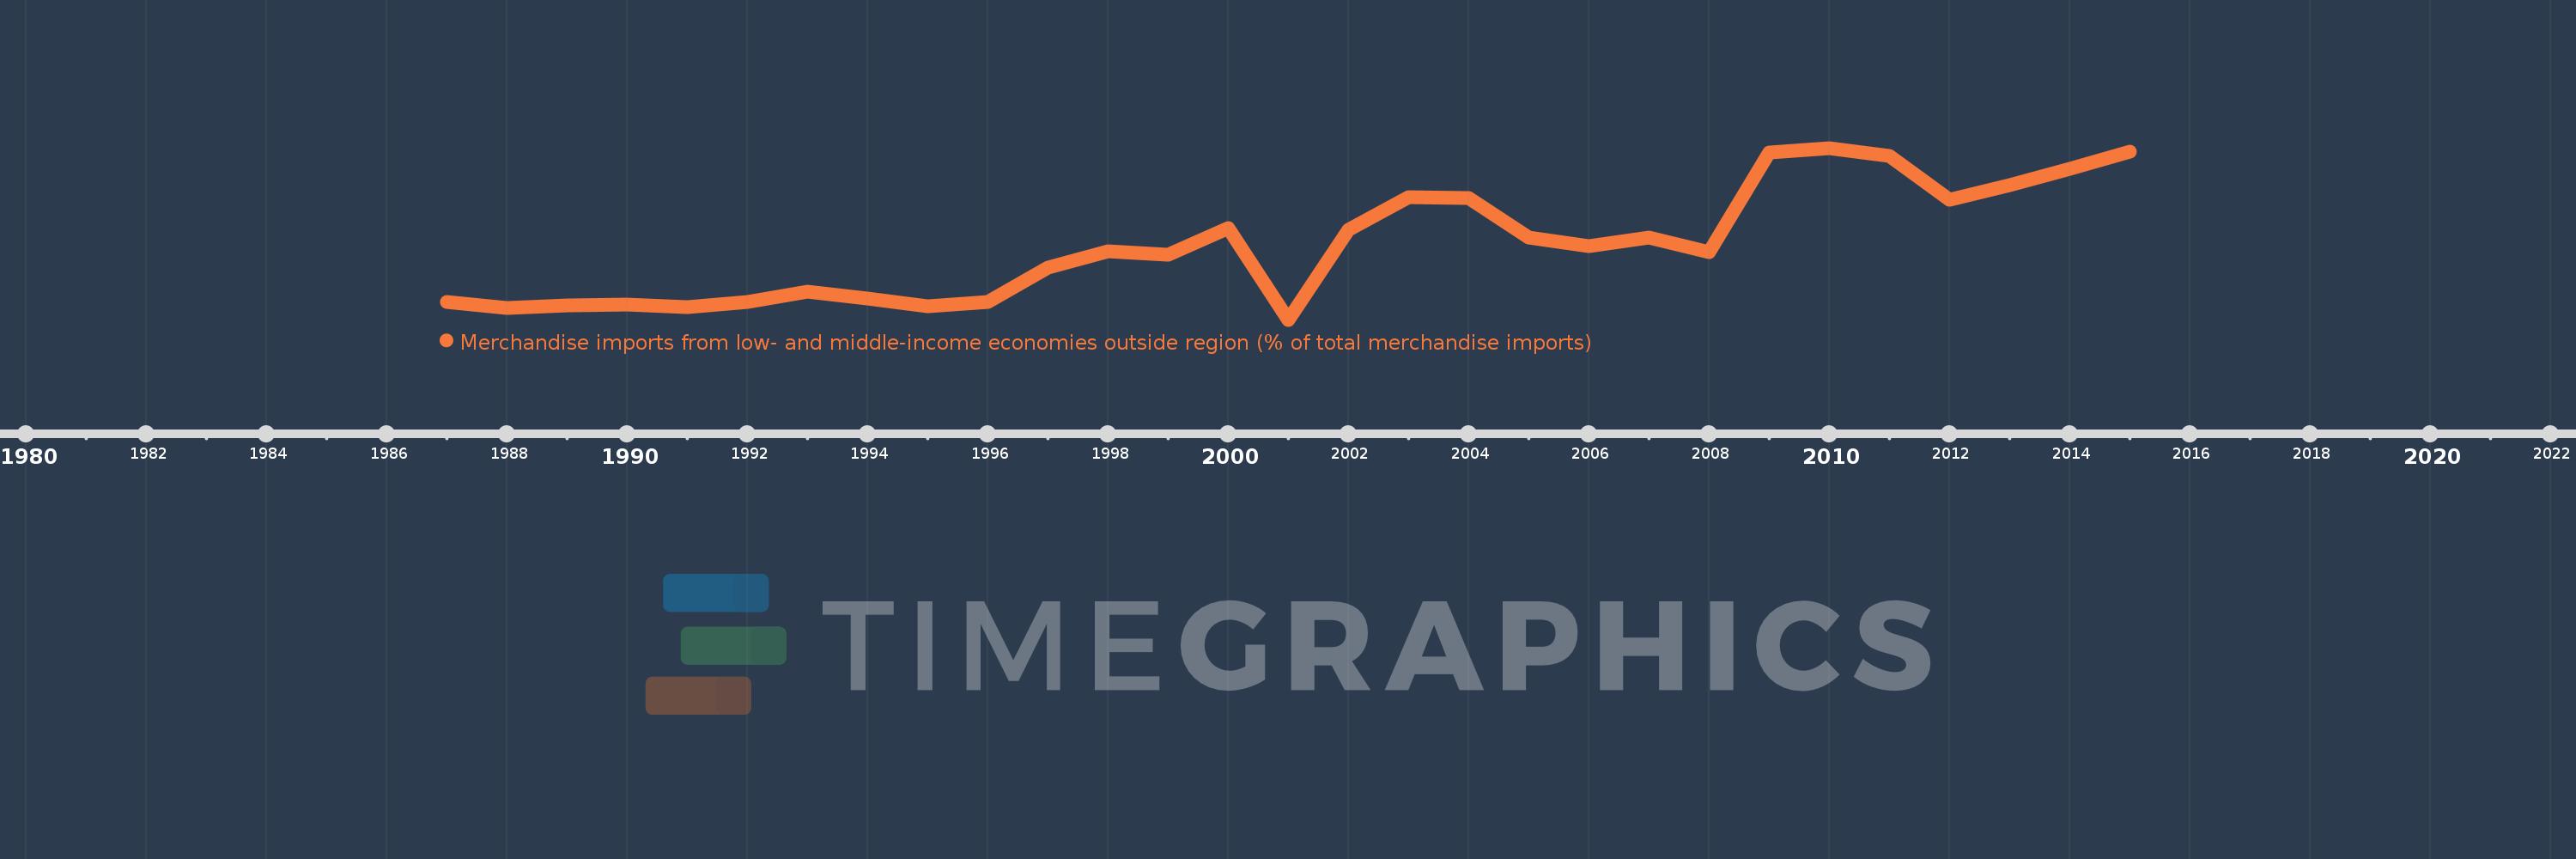
Nesta escala de tempo está apresentado um gráfico de 1987 ano até 2015 ano Niger. Dados de 1986 ano ausente. O número de observações reais por data: 29.
Fonte (nome):
Indicadores de desenvolvimento mundial
Fonte (organização):
World Bank staff estimates based data from International Monetary Fund's Direction of Trade database.
Categorias:
Private Sector, Trade
Foi atualizado:
23 abr 2017 ano
Indicadores de alterações dos valores ao longo dos anos
Mínimo:
5.578
1 jan 2001 ano
Máximo:
31.094
1 jan 2010 ano
Na data de observação
Valor
Mudança absoluta
A alteração em relação ao valor anterior
1 jan 1987 ano
8.206
+8.206
0.0%
1 jan 1988 ano
7.285
-0.921
-11.22%
1 jan 1989 ano
7.668
+0.383
5.26%
1 jan 1990 ano
7.815
+0.147
1.91%
1 jan 1991 ano
7.444
-0.37
-4.74%
1 jan 1992 ano
8.201
+0.756
10.16%
1 jan 1993 ano
9.756
+1.555
18.97%
1 jan 1994 ano
8.71
-1.046
-10.72%
1 jan 1995 ano
7.64
-1.07
-12.28%
1 jan 1996 ano
8.164
+0.523
6.85%
1 jan 1997 ano
13.304
+5.14
62.96%
1 jan 1998 ano
15.747
+2.444
18.37%
1 jan 1999 ano
15.241
-0.507
-3.22%
1 jan 2000 ano
19.203
+3.962
26.0%
1 jan 2001 ano
5.578
-13.624
-70.95%
1 jan 2002 ano
18.89
+13.312
238.64%
1 jan 2003 ano
23.764
+4.873
25.8%
1 jan 2004 ano
23.602
-0.162
-0.68%
1 jan 2005 ano
17.726
-5.875
-24.89%
1 jan 2006 ano
16.574
-1.153
-6.5%
1 jan 2007 ano
17.741
+1.167
7.04%
1 jan 2008 ano
15.617
-2.124
-11.97%
1 jan 2009 ano
30.451
+14.834
94.99%
1 jan 2010 ano
31.094
+0.643
2.11%
1 jan 2011 ano
29.877
-1.217
-3.91%
1 jan 2012 ano
23.463
-6.414
-21.47%
1 jan 2013 ano
25.625
+2.162
9.21%
1 jan 2014 ano
27.975
+2.35
9.17%
1 jan 2015 ano
30.568
+2.593
9.27%
Classificação de países por estatísticas atuais por anos


Comentários: