29
/pt/
pt
AIzaSyAYiBZKx7MnpbEhh9jyipgxe19OcubqV5w
April 1, 2024
38359
IDA blend
IDB
false
2
1
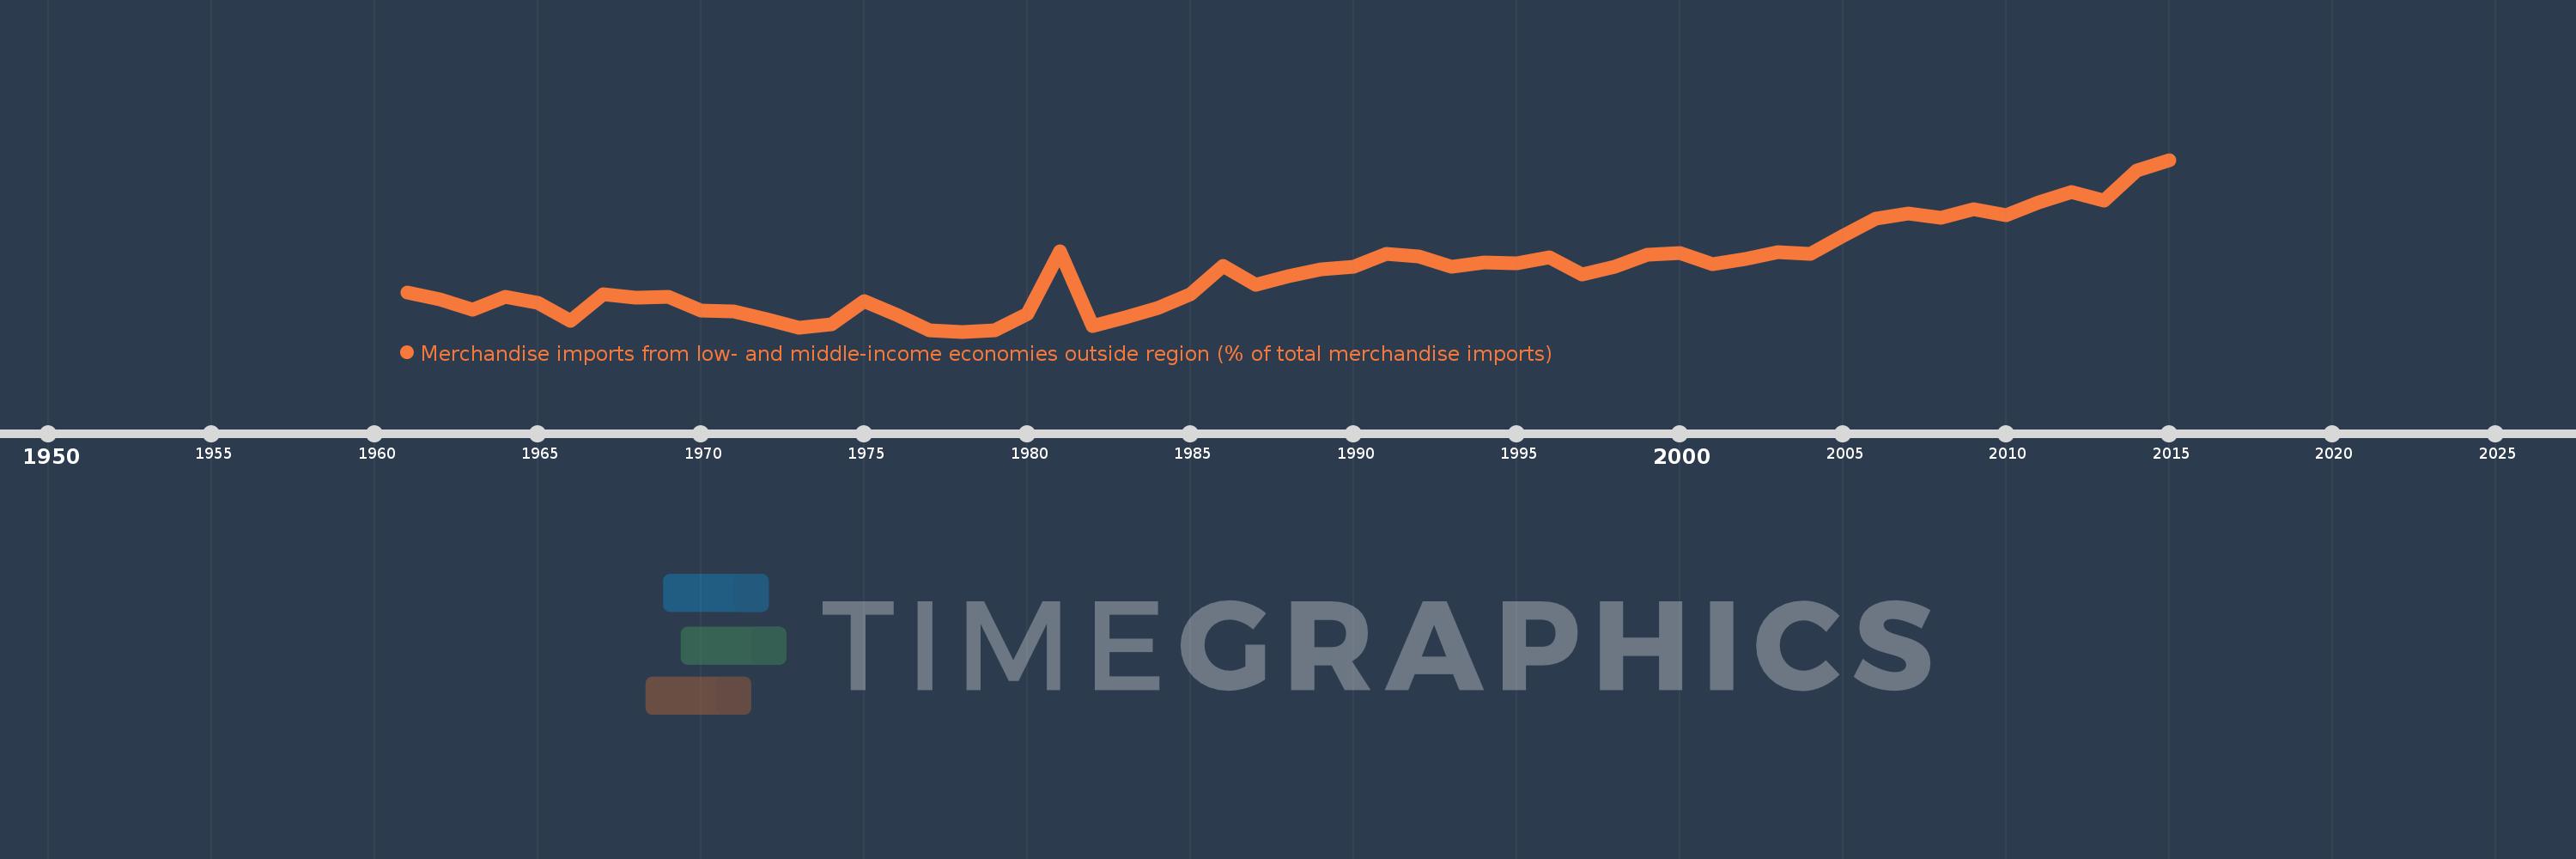
Merchandise imports from low- and middle-income economies outside region (% of total merchandise imports)
2015,2014,2013,2012,2011,2010,2009,2008,2007,2006,2005,2004,2003,2002,2001,2000,1999,1998,1997,1996,1995,1994,1993,1992,1991,1990,1989,1988,1987,1986,1985,1984,1983,1982,1981,1980,1979,1978,1977,1976,1975,1974,1973,1972,1971,1970,1969,1968,1967,1966,1965,1964,1963,1962,1961
Estas estatísticas em outros países:
AfghanistanAlbaniaAlgeriaAngolaArab WorldArgentinaArmeniaArubaAustraliaAustriaAzerbaijanBahamas, TheBahrainBangladeshBarbadosBelarusBelgiumBelizeBeninBermudaBoliviaBrazilBrunei DarussalamBulgariaBurkina FasoBurundiCabo VerdeCambodiaCameroonCanadaCaribbean small statesCentral African RepublicCentral Europe and the BalticsChileChinaColombiaCongo, Dem. Rep.Congo, Rep.Costa RicaCote d'IvoireCroatiaCubaCyprusCzech RepublicDenmarkDominicaDominican RepublicEarly-demographic dividendEast Asia & PacificEast Asia & Pacific (excluding high income)East Asia & Pacific (IDA & IBRD countries)EcuadorEgypt, Arab Rep.El SalvadorEstoniaEthiopiaEuro areaEurope & Central AsiaEurope & Central Asia (excluding high income)Europe & Central Asia (IDA & IBRD countries)European UnionFijiFinlandFragile and conflict affected situationsFranceGabonGambia, TheGeorgiaGermanyGhanaGreeceGreenlandGrenadaGuatemalaGuineaGuyanaHaitiHeavily indebted poor countries (HIPC)High incomeHondurasHong Kong SAR, ChinaHungaryIBRD onlyIcelandIDA & IBRD totalIDA blendIDA onlyIDA totalIndiaIndonesiaIran, Islamic Rep.IraqIrelandIsraelItalyJamaicaJapanJordanKazakhstanKenyaKorea, Dem. People’s Rep.Korea, Rep.KuwaitKyrgyz RepublicLao PDRLate-demographic dividendLatin America & Caribbean Latin America & Caribbean (excluding high income)Latin America & the Caribbean (IDA & IBRD countries)LatviaLeast developed countries: UN classificationLebanonLiberiaLibyaLithuaniaLow & middle incomeLow incomeLower middle incomeLuxembourgMacao SAR, ChinaMacedonia, FYRMadagascarMalawiMalaysiaMaliMaltaMauritaniaMauritiusMexicoMiddle East & North AfricaMiddle East & North Africa (excluding high income)Middle East & North Africa (IDA & IBRD countries)Middle incomeMoldovaMongoliaMontenegroMoroccoMozambiqueMyanmarNetherlandsNew CaledoniaNew ZealandNicaraguaNigerNigeriaNorth AmericaNorwayOECD membersOmanOther small statesPacific island small statesPakistanPanamaPapua New GuineaParaguayPeruPhilippinesPolandPortugalPost-demographic dividendPre-demographic dividendQatarRomaniaRussian FederationRwandaSaudi ArabiaSenegalSerbiaSeychellesSierra LeoneSingaporeSlovak RepublicSloveniaSmall statesSomaliaSouth AfricaSouth AsiaSouth Asia (IDA & IBRD)SpainSri LankaSt. Kitts and NevisSt. LuciaSt. Vincent and the GrenadinesSub-Saharan Africa Sub-Saharan Africa (excluding high income)Sub-Saharan Africa (IDA & IBRD countries)SudanSurinameSwedenSwitzerlandSyrian Arab RepublicTanzaniaThailandTogoTrinidad and TobagoTunisiaTurkeyUgandaUkraineUnited Arab EmiratesUnited KingdomUnited StatesUpper middle incomeUruguayVenezuela, RBVietnamWorldYemen, Rep.ZambiaZimbabwe Linha do tempo:
Nesta escala de tempo está apresentado um gráfico de 1961 ano até 2015 ano IDA blend. Dados de 1960 ano ausente. O número de observações reais por data: 55.
Fonte (nome):
Indicadores de desenvolvimento mundial
Fonte (organização):
World Bank staff estimates based data from International Monetary Fund's Direction of Trade database.
Categorias:
Private Sector, Trade
Foi atualizado:
23 abr 2017 ano
Indicadores de alterações dos valores ao longo dos anos
Mínimo:
2.77
1 jan 1978 ano
Máximo:
21.87
1 jan 2015 ano
Na data de observação
Valor
Mudança absoluta
A alteração em relação ao valor anterior
1 jan 1961 ano
7.092
+7.092
0.0%
1 jan 1962 ano
6.351
-0.741
-10.44%
1 jan 1963 ano
5.198
-1.154
-18.17%
1 jan 1964 ano
6.672
+1.474
28.36%
1 jan 1965 ano
5.924
-0.748
-11.21%
1 jan 1966 ano
3.967
-1.956
-33.03%
1 jan 1967 ano
6.952
+2.985
75.24%
1 jan 1968 ano
6.553
-0.399
-5.74%
1 jan 1969 ano
6.603
+0.05
0.77%
1 jan 1970 ano
5.067
-1.536
-23.27%
1 jan 1971 ano
4.994
-0.073
-1.44%
1 jan 1972 ano
4.11
-0.884
-17.71%
1 jan 1973 ano
3.157
-0.953
-23.19%
1 jan 1974 ano
3.548
+0.392
12.41%
1 jan 1975 ano
6.181
+2.633
74.2%
1 jan 1976 ano
4.592
-1.589
-25.71%
1 jan 1977 ano
2.897
-1.695
-36.92%
1 jan 1978 ano
2.77
-0.126
-4.35%
1 jan 1979 ano
2.894
+0.123
4.46%
1 jan 1980 ano
4.755
+1.861
64.3%
1 jan 1981 ano
11.663
+6.908
145.29%
1 jan 1982 ano
3.408
-8.255
-70.78%
1 jan 1983 ano
4.334
+0.927
27.2%
1 jan 1984 ano
5.364
+1.029
23.75%
1 jan 1985 ano
6.899
+1.535
28.62%
1 jan 1986 ano
10.057
+3.158
45.78%
1 jan 1987 ano
7.964
-2.094
-20.82%
1 jan 1988 ano
8.975
+1.011
12.7%
1 jan 1989 ano
9.653
+0.678
7.55%
1 jan 1990 ano
10.021
+0.368
3.82%
1 jan 1991 ano
11.424
+1.403
14.0%
1 jan 1992 ano
11.088
-0.336
-2.94%
1 jan 1993 ano
9.97
-1.118
-10.09%
1 jan 1994 ano
10.424
+0.454
4.55%
1 jan 1995 ano
10.374
-0.049
-0.47%
1 jan 1996 ano
11.023
+0.649
6.25%
1 jan 1997 ano
9.11
-1.913
-17.35%
1 jan 1998 ano
10.02
+0.909
9.98%
1 jan 1999 ano
11.292
+1.272
12.7%
1 jan 2000 ano
11.503
+0.211
1.87%
1 jan 2001 ano
10.283
-1.22
-10.61%
1 jan 2002 ano
10.852
+0.569
5.53%
1 jan 2003 ano
11.576
+0.725
6.68%
1 jan 2004 ano
11.45
-0.127
-1.09%
1 jan 2005 ano
13.463
+2.013
17.58%
1 jan 2006 ano
15.283
+1.82
13.52%
1 jan 2007 ano
15.858
+0.575
3.76%
1 jan 2008 ano
15.459
-0.399
-2.52%
1 jan 2009 ano
16.401
+0.943
6.1%
1 jan 2010 ano
15.684
-0.717
-4.37%
1 jan 2011 ano
17.137
+1.453
9.27%
1 jan 2012 ano
18.261
+1.124
6.56%
1 jan 2013 ano
17.344
-0.918
-5.02%
1 jan 2014 ano
20.723
+3.379
19.48%
1 jan 2015 ano
21.87
+1.147
5.54%
Classificação de países por estatísticas atuais por anos


Comentários: