29
/pt/
pt
AIzaSyAYiBZKx7MnpbEhh9jyipgxe19OcubqV5w
April 1, 2024
275950
United Kingdom
GBR
true
2
1
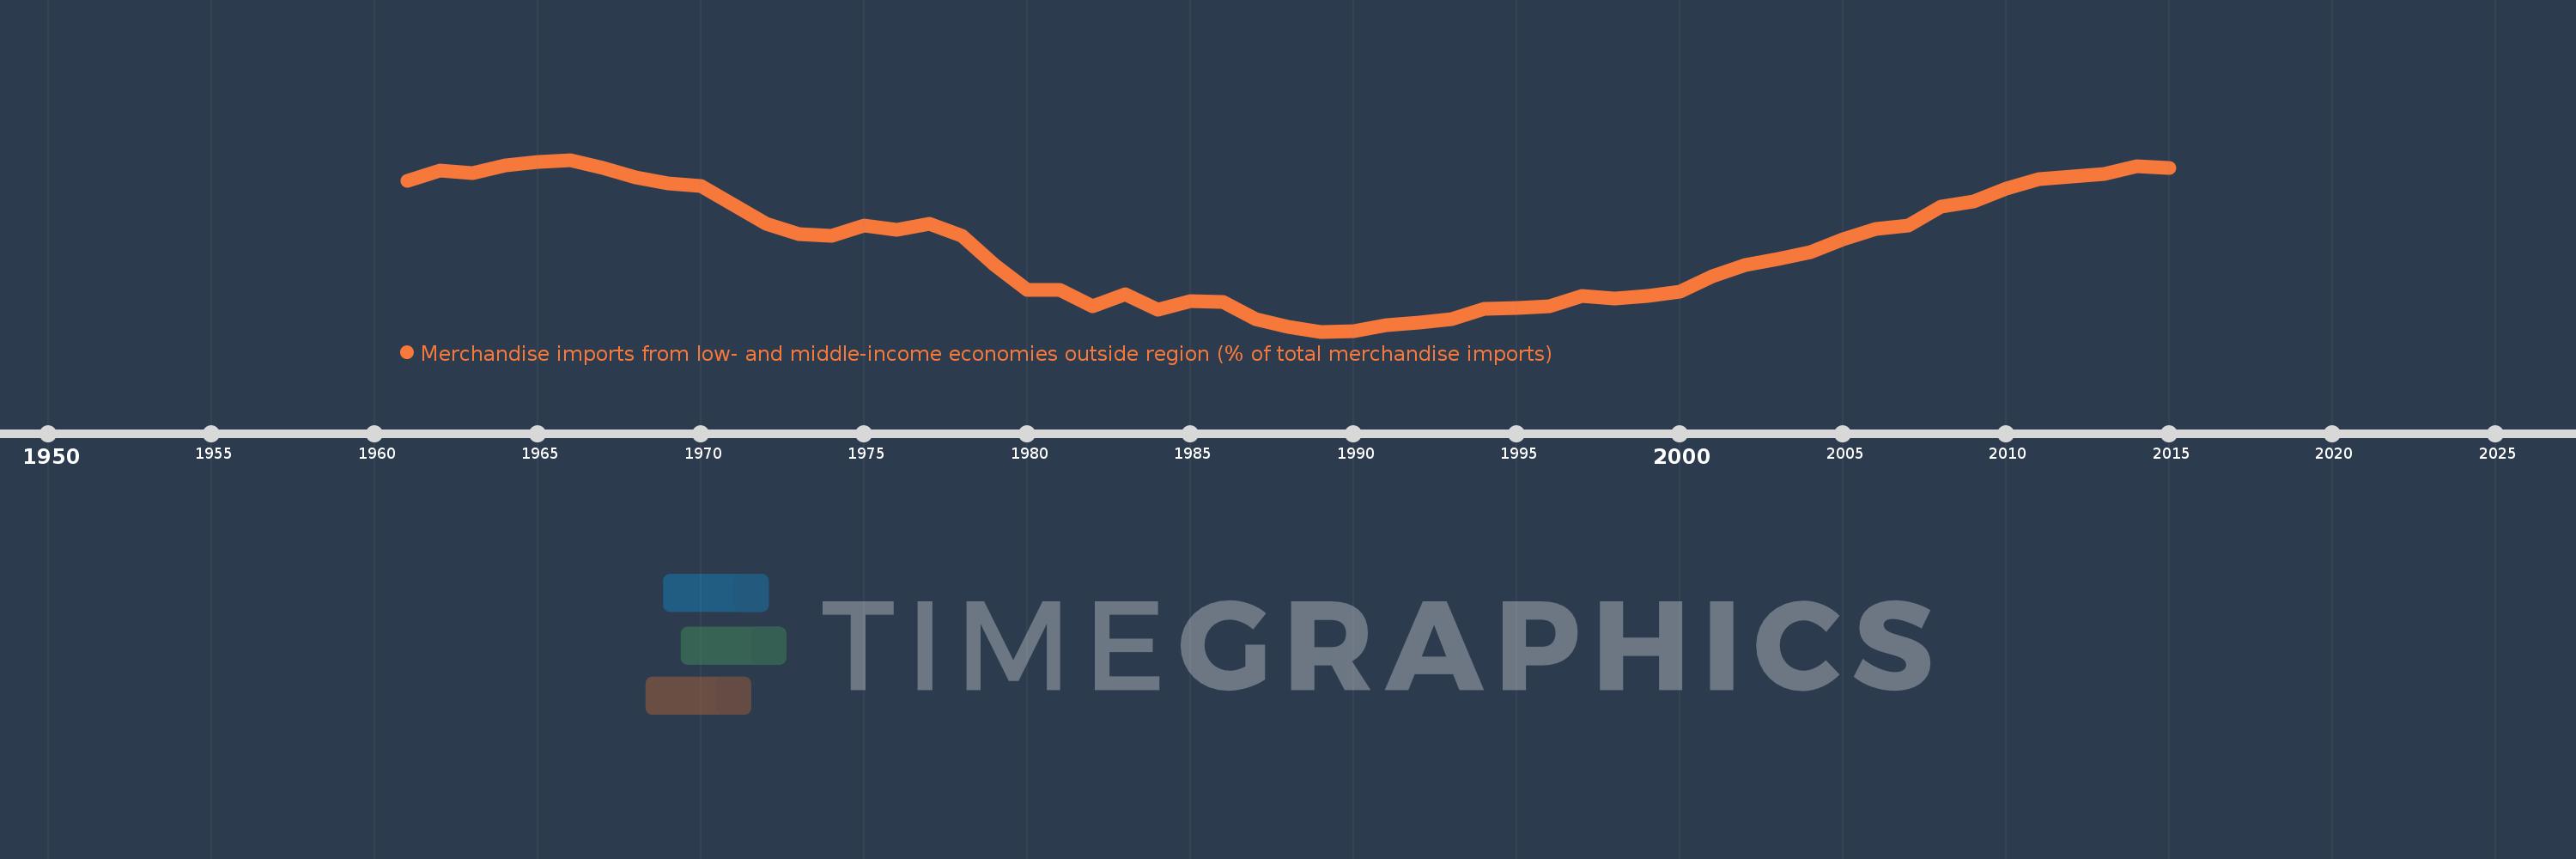
Merchandise imports from low- and middle-income economies outside region (% of total merchandise imports)
2015,2014,2013,2012,2011,2010,2009,2008,2007,2006,2005,2004,2003,2002,2001,2000,1999,1998,1997,1996,1995,1994,1993,1992,1991,1990,1989,1988,1987,1986,1985,1984,1983,1982,1981,1980,1979,1978,1977,1976,1975,1974,1973,1972,1971,1970,1969,1968,1967,1966,1965,1964,1963,1962,1961
Estas estatísticas em outros países:
AfghanistanAlbaniaAlgeriaAngolaArab WorldArgentinaArmeniaArubaAustraliaAustriaAzerbaijanBahamas, TheBahrainBangladeshBarbadosBelarusBelgiumBelizeBeninBermudaBoliviaBrazilBrunei DarussalamBulgariaBurkina FasoBurundiCabo VerdeCambodiaCameroonCanadaCaribbean small statesCentral African RepublicCentral Europe and the BalticsChileChinaColombiaCongo, Dem. Rep.Congo, Rep.Costa RicaCote d'IvoireCroatiaCubaCyprusCzech RepublicDenmarkDominicaDominican RepublicEarly-demographic dividendEast Asia & PacificEast Asia & Pacific (excluding high income)East Asia & Pacific (IDA & IBRD countries)EcuadorEgypt, Arab Rep.El SalvadorEstoniaEthiopiaEuro areaEurope & Central AsiaEurope & Central Asia (excluding high income)Europe & Central Asia (IDA & IBRD countries)European UnionFijiFinlandFragile and conflict affected situationsFranceGabonGambia, TheGeorgiaGermanyGhanaGreeceGreenlandGrenadaGuatemalaGuineaGuyanaHaitiHeavily indebted poor countries (HIPC)High incomeHondurasHong Kong SAR, ChinaHungaryIBRD onlyIcelandIDA & IBRD totalIDA blendIDA onlyIDA totalIndiaIndonesiaIran, Islamic Rep.IraqIrelandIsraelItalyJamaicaJapanJordanKazakhstanKenyaKorea, Dem. People’s Rep.Korea, Rep.KuwaitKyrgyz RepublicLao PDRLate-demographic dividendLatin America & Caribbean Latin America & Caribbean (excluding high income)Latin America & the Caribbean (IDA & IBRD countries)LatviaLeast developed countries: UN classificationLebanonLiberiaLibyaLithuaniaLow & middle incomeLow incomeLower middle incomeLuxembourgMacao SAR, ChinaMacedonia, FYRMadagascarMalawiMalaysiaMaliMaltaMauritaniaMauritiusMexicoMiddle East & North AfricaMiddle East & North Africa (excluding high income)Middle East & North Africa (IDA & IBRD countries)Middle incomeMoldovaMongoliaMontenegroMoroccoMozambiqueMyanmarNetherlandsNew CaledoniaNew ZealandNicaraguaNigerNigeriaNorth AmericaNorwayOECD membersOmanOther small statesPacific island small statesPakistanPanamaPapua New GuineaParaguayPeruPhilippinesPolandPortugalPost-demographic dividendPre-demographic dividendQatarRomaniaRussian FederationRwandaSaudi ArabiaSenegalSerbiaSeychellesSierra LeoneSingaporeSlovak RepublicSloveniaSmall statesSomaliaSouth AfricaSouth AsiaSouth Asia (IDA & IBRD)SpainSri LankaSt. Kitts and NevisSt. LuciaSt. Vincent and the GrenadinesSub-Saharan Africa Sub-Saharan Africa (excluding high income)Sub-Saharan Africa (IDA & IBRD countries)SudanSurinameSwedenSwitzerlandSyrian Arab RepublicTanzaniaThailandTogoTrinidad and TobagoTunisiaTurkeyUgandaUkraineUnited Arab EmiratesUnited KingdomUnited StatesUpper middle incomeUruguayVenezuela, RBVietnamWorldYemen, Rep.ZambiaZimbabwe Linha do tempo:
Nesta escala de tempo está apresentado um gráfico de 1961 ano até 2015 ano United Kingdom. Dados de 1960 ano ausente. O número de observações reais por data: 55.
Fonte (nome):
Indicadores de desenvolvimento mundial
Fonte (organização):
World Bank staff estimates based data from International Monetary Fund's Direction of Trade database.
Categorias:
Private Sector, Trade
Foi atualizado:
23 abr 2017 ano
Indicadores de alterações dos valores ao longo dos anos
Mínimo:
7.007
1 jan 1989 ano
Máximo:
22.073
1 jan 1966 ano
Na data de observação
Valor
Mudança absoluta
A alteração em relação ao valor anterior
1 jan 1961 ano
20.248
+20.248
0.0%
1 jan 1962 ano
21.112
+0.864
4.27%
1 jan 1963 ano
20.899
-0.213
-1.01%
1 jan 1964 ano
21.589
+0.689
3.3%
1 jan 1965 ano
21.867
+0.278
1.29%
1 jan 1966 ano
22.073
+0.207
0.94%
1 jan 1967 ano
21.321
-0.753
-3.41%
1 jan 1968 ano
20.523
-0.797
-3.74%
1 jan 1969 ano
20.03
-0.493
-2.4%
1 jan 1970 ano
19.805
-0.225
-1.12%
1 jan 1971 ano
18.133
-1.672
-8.44%
1 jan 1972 ano
16.467
-1.666
-9.19%
1 jan 1973 ano
15.523
-0.944
-5.73%
1 jan 1974 ano
15.378
-0.146
-0.94%
1 jan 1975 ano
16.285
+0.907
5.9%
1 jan 1976 ano
15.92
-0.365
-2.24%
1 jan 1977 ano
16.433
+0.513
3.22%
1 jan 1978 ano
15.426
-1.006
-6.12%
1 jan 1979 ano
12.846
-2.581
-16.73%
1 jan 1980 ano
10.665
-2.181
-16.98%
1 jan 1981 ano
10.67
+0.005
0.05%
1 jan 1982 ano
9.257
-1.413
-13.25%
1 jan 1983 ano
10.317
+1.061
11.46%
1 jan 1984 ano
8.936
-1.381
-13.39%
1 jan 1985 ano
9.651
+0.715
8.0%
1 jan 1986 ano
9.589
-0.061
-0.64%
1 jan 1987 ano
8.098
-1.491
-15.55%
1 jan 1988 ano
7.41
-0.688
-8.5%
1 jan 1989 ano
7.007
-0.403
-5.43%
1 jan 1990 ano
7.054
+0.046
0.66%
1 jan 1991 ano
7.569
+0.516
7.31%
1 jan 1992 ano
7.783
+0.214
2.82%
1 jan 1993 ano
8.093
+0.31
3.99%
1 jan 1994 ano
9.032
+0.939
11.6%
1 jan 1995 ano
9.053
+0.021
0.23%
1 jan 1996 ano
9.26
+0.208
2.29%
1 jan 1997 ano
10.131
+0.871
9.4%
1 jan 1998 ano
9.913
-0.218
-2.15%
1 jan 1999 ano
10.13
+0.217
2.19%
1 jan 2000 ano
10.497
+0.367
3.63%
1 jan 2001 ano
11.855
+1.358
12.94%
1 jan 2002 ano
12.839
+0.984
8.3%
1 jan 2003 ano
13.389
+0.55
4.28%
1 jan 2004 ano
13.963
+0.575
4.29%
1 jan 2005 ano
15.068
+1.105
7.91%
1 jan 2006 ano
15.988
+0.92
6.11%
1 jan 2007 ano
16.34
+0.351
2.2%
1 jan 2008 ano
17.984
+1.645
10.07%
1 jan 2009 ano
18.419
+0.435
2.42%
1 jan 2010 ano
19.53
+1.111
6.03%
1 jan 2011 ano
20.411
+0.88
4.51%
1 jan 2012 ano
20.629
+0.218
1.07%
1 jan 2013 ano
20.855
+0.226
1.09%
1 jan 2014 ano
21.479
+0.624
2.99%
1 jan 2015 ano
21.331
-0.148
-0.69%
Classificação de países por estatísticas atuais por anos


Comentários: