29
/pt/
pt
AIzaSyAYiBZKx7MnpbEhh9jyipgxe19OcubqV5w
April 1, 2024
46321
Low income
LIC
false
2
1
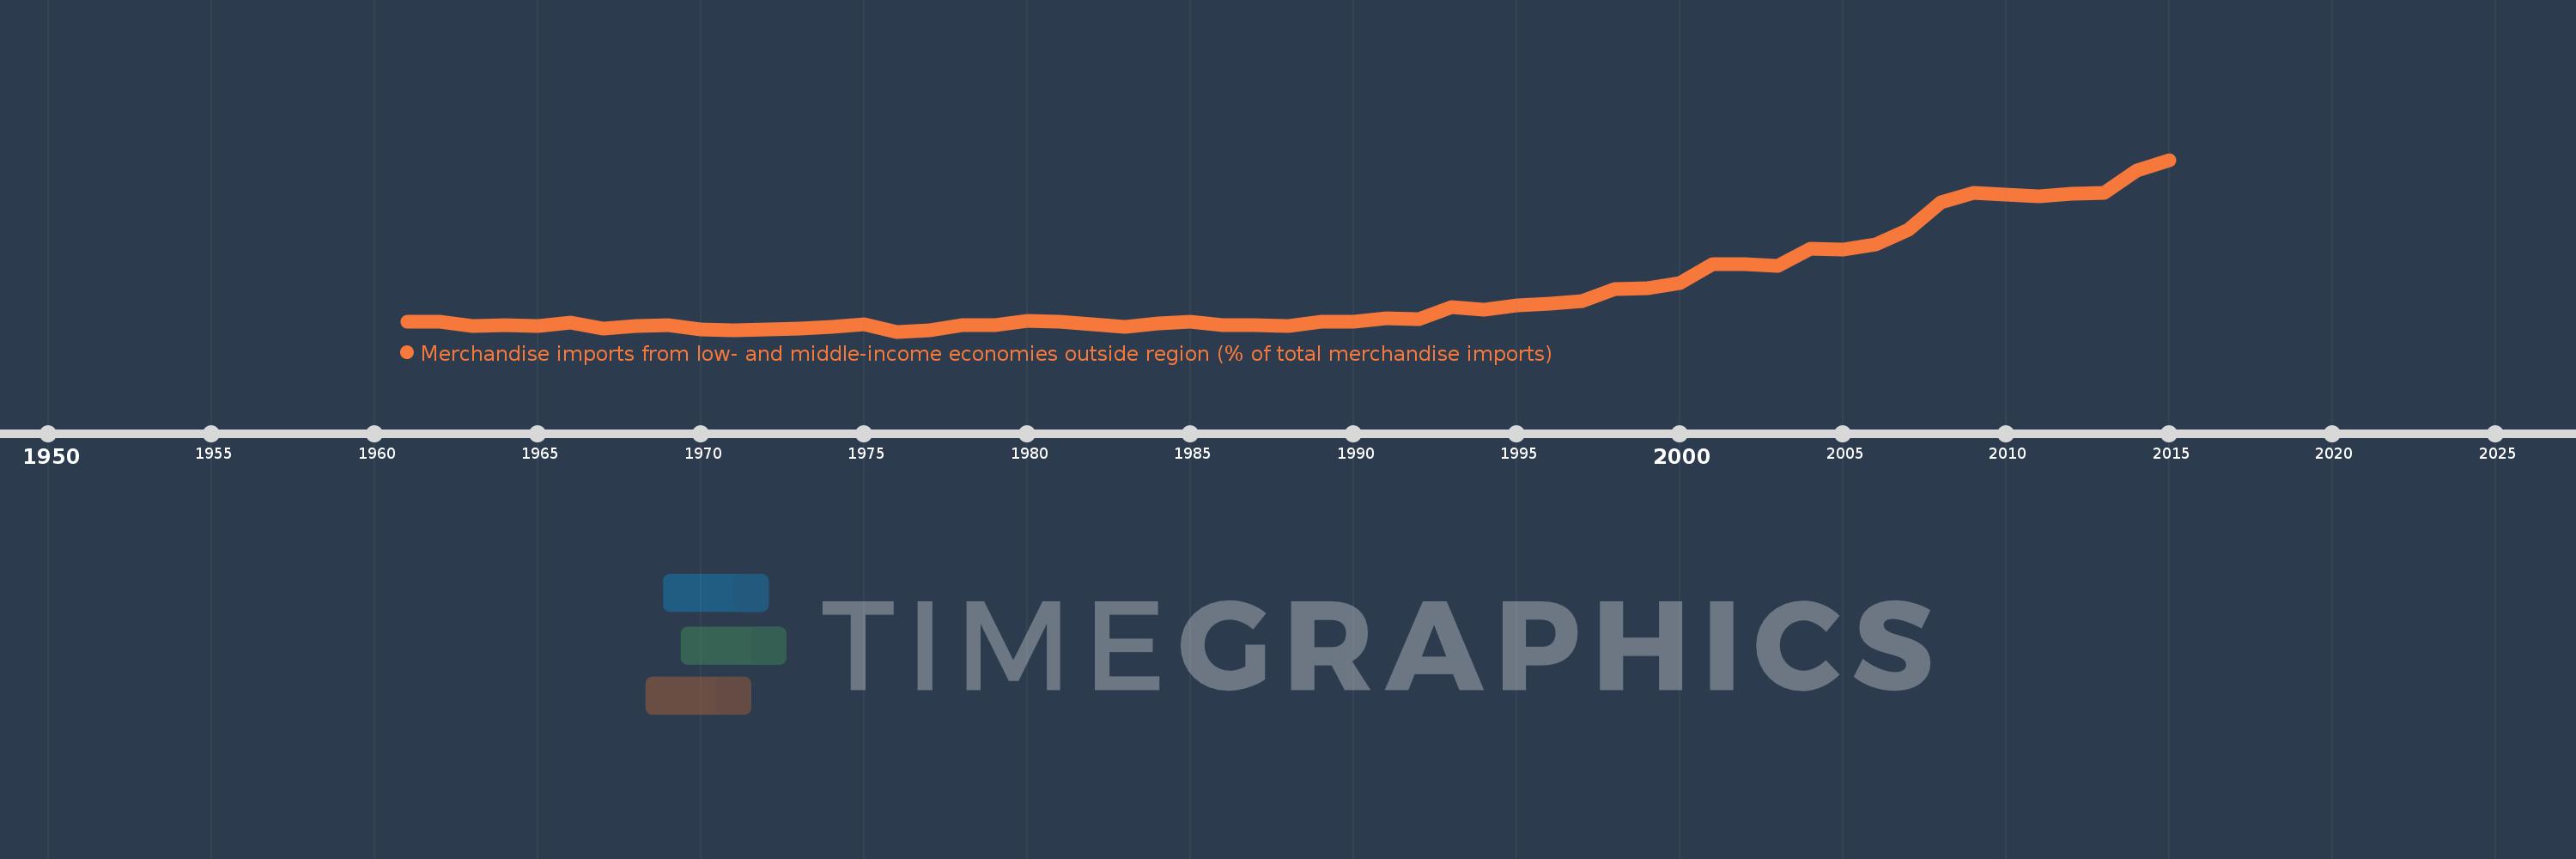
Merchandise imports from low- and middle-income economies outside region (% of total merchandise imports)
2015,2014,2013,2012,2011,2010,2009,2008,2007,2006,2005,2004,2003,2002,2001,2000,1999,1998,1997,1996,1995,1994,1993,1992,1991,1990,1989,1988,1987,1986,1985,1984,1983,1982,1981,1980,1979,1978,1977,1976,1975,1974,1973,1972,1971,1970,1969,1968,1967,1966,1965,1964,1963,1962,1961
Estas estatísticas em outros países:
AfghanistanAlbaniaAlgeriaAngolaArab WorldArgentinaArmeniaArubaAustraliaAustriaAzerbaijanBahamas, TheBahrainBangladeshBarbadosBelarusBelgiumBelizeBeninBermudaBoliviaBrazilBrunei DarussalamBulgariaBurkina FasoBurundiCabo VerdeCambodiaCameroonCanadaCaribbean small statesCentral African RepublicCentral Europe and the BalticsChileChinaColombiaCongo, Dem. Rep.Congo, Rep.Costa RicaCote d'IvoireCroatiaCubaCyprusCzech RepublicDenmarkDominicaDominican RepublicEarly-demographic dividendEast Asia & PacificEast Asia & Pacific (excluding high income)East Asia & Pacific (IDA & IBRD countries)EcuadorEgypt, Arab Rep.El SalvadorEstoniaEthiopiaEuro areaEurope & Central AsiaEurope & Central Asia (excluding high income)Europe & Central Asia (IDA & IBRD countries)European UnionFijiFinlandFragile and conflict affected situationsFranceGabonGambia, TheGeorgiaGermanyGhanaGreeceGreenlandGrenadaGuatemalaGuineaGuyanaHaitiHeavily indebted poor countries (HIPC)High incomeHondurasHong Kong SAR, ChinaHungaryIBRD onlyIcelandIDA & IBRD totalIDA blendIDA onlyIDA totalIndiaIndonesiaIran, Islamic Rep.IraqIrelandIsraelItalyJamaicaJapanJordanKazakhstanKenyaKorea, Dem. People’s Rep.Korea, Rep.KuwaitKyrgyz RepublicLao PDRLate-demographic dividendLatin America & Caribbean Latin America & Caribbean (excluding high income)Latin America & the Caribbean (IDA & IBRD countries)LatviaLeast developed countries: UN classificationLebanonLiberiaLibyaLithuaniaLow & middle incomeLow incomeLower middle incomeLuxembourgMacao SAR, ChinaMacedonia, FYRMadagascarMalawiMalaysiaMaliMaltaMauritaniaMauritiusMexicoMiddle East & North AfricaMiddle East & North Africa (excluding high income)Middle East & North Africa (IDA & IBRD countries)Middle incomeMoldovaMongoliaMontenegroMoroccoMozambiqueMyanmarNetherlandsNew CaledoniaNew ZealandNicaraguaNigerNigeriaNorth AmericaNorwayOECD membersOmanOther small statesPacific island small statesPakistanPanamaPapua New GuineaParaguayPeruPhilippinesPolandPortugalPost-demographic dividendPre-demographic dividendQatarRomaniaRussian FederationRwandaSaudi ArabiaSenegalSerbiaSeychellesSierra LeoneSingaporeSlovak RepublicSloveniaSmall statesSomaliaSouth AfricaSouth AsiaSouth Asia (IDA & IBRD)SpainSri LankaSt. Kitts and NevisSt. LuciaSt. Vincent and the GrenadinesSub-Saharan Africa Sub-Saharan Africa (excluding high income)Sub-Saharan Africa (IDA & IBRD countries)SudanSurinameSwedenSwitzerlandSyrian Arab RepublicTanzaniaThailandTogoTrinidad and TobagoTunisiaTurkeyUgandaUkraineUnited Arab EmiratesUnited KingdomUnited StatesUpper middle incomeUruguayVenezuela, RBVietnamWorldYemen, Rep.ZambiaZimbabwe Linha do tempo:
Nesta escala de tempo está apresentado um gráfico de 1961 ano até 2015 ano Low income. Dados de 1960 ano ausente. O número de observações reais por data: 55.
Fonte (nome):
Indicadores de desenvolvimento mundial
Fonte (organização):
World Bank staff estimates based data from International Monetary Fund's Direction of Trade database.
Categorias:
Private Sector, Trade
Foi atualizado:
23 abr 2017 ano
Indicadores de alterações dos valores ao longo dos anos
Mínimo:
0.377
1 jan 1976 ano
Máximo:
33.443
1 jan 2015 ano
Na data de observação
Valor
Mudança absoluta
A alteração em relação ao valor anterior
1 jan 1961 ano
2.21
+2.21
0.0%
1 jan 1962 ano
2.222
+0.013
0.58%
1 jan 1963 ano
1.479
-0.744
-33.46%
1 jan 1964 ano
1.628
+0.149
10.06%
1 jan 1965 ano
1.466
-0.161
-9.92%
1 jan 1966 ano
2.1
+0.634
43.23%
1 jan 1967 ano
0.914
-1.187
-56.5%
1 jan 1968 ano
1.389
+0.476
52.08%
1 jan 1969 ano
1.615
+0.225
16.22%
1 jan 1970 ano
0.847
-0.767
-47.53%
1 jan 1971 ano
0.548
-0.299
-35.27%
1 jan 1972 ano
0.794
+0.245
44.68%
1 jan 1973 ano
0.937
+0.143
18.02%
1 jan 1974 ano
1.319
+0.383
40.85%
1 jan 1975 ano
1.857
+0.538
40.79%
1 jan 1976 ano
0.377
-1.48
-79.71%
1 jan 1977 ano
0.598
+0.221
58.58%
1 jan 1978 ano
1.611
+1.013
169.55%
1 jan 1979 ano
1.666
+0.055
3.44%
1 jan 1980 ano
2.413
+0.747
44.85%
1 jan 1981 ano
2.336
-0.077
-3.21%
1 jan 1982 ano
1.849
-0.487
-20.85%
1 jan 1983 ano
1.365
-0.484
-26.2%
1 jan 1984 ano
1.916
+0.551
40.37%
1 jan 1985 ano
2.253
+0.338
17.62%
1 jan 1986 ano
1.651
-0.602
-26.73%
1 jan 1987 ano
1.608
-0.043
-2.61%
1 jan 1988 ano
1.515
-0.093
-5.75%
1 jan 1989 ano
2.346
+0.83
54.79%
1 jan 1990 ano
2.2
-0.146
-6.22%
1 jan 1991 ano
2.936
+0.736
33.47%
1 jan 1992 ano
2.831
-0.105
-3.58%
1 jan 1993 ano
5.127
+2.296
81.12%
1 jan 1994 ano
4.542
-0.586
-11.42%
1 jan 1995 ano
5.428
+0.886
19.51%
1 jan 1996 ano
5.804
+0.377
6.94%
1 jan 1997 ano
6.197
+0.393
6.76%
1 jan 1998 ano
8.633
+2.436
39.31%
1 jan 1999 ano
8.764
+0.132
1.53%
1 jan 2000 ano
9.76
+0.996
11.36%
1 jan 2001 ano
13.348
+3.588
36.76%
1 jan 2002 ano
13.356
+0.008
0.06%
1 jan 2003 ano
12.947
-0.409
-3.06%
1 jan 2004 ano
16.323
+3.375
26.07%
1 jan 2005 ano
16.187
-0.136
-0.83%
1 jan 2006 ano
17.129
+0.942
5.82%
1 jan 2007 ano
20.039
+2.91
16.99%
1 jan 2008 ano
25.26
+5.221
26.05%
1 jan 2009 ano
27.11
+1.85
7.32%
1 jan 2010 ano
26.681
-0.428
-1.58%
1 jan 2011 ano
26.492
-0.19
-0.71%
1 jan 2012 ano
26.878
+0.386
1.46%
1 jan 2013 ano
27.04
+0.163
0.6%
1 jan 2014 ano
31.347
+4.307
15.93%
1 jan 2015 ano
33.443
+2.096
6.69%
Classificação de países por estatísticas atuais por anos


Comentários: