29
/pt/
pt
AIzaSyAYiBZKx7MnpbEhh9jyipgxe19OcubqV5w
April 1, 2024
222490
Peru
PER
true
2
1
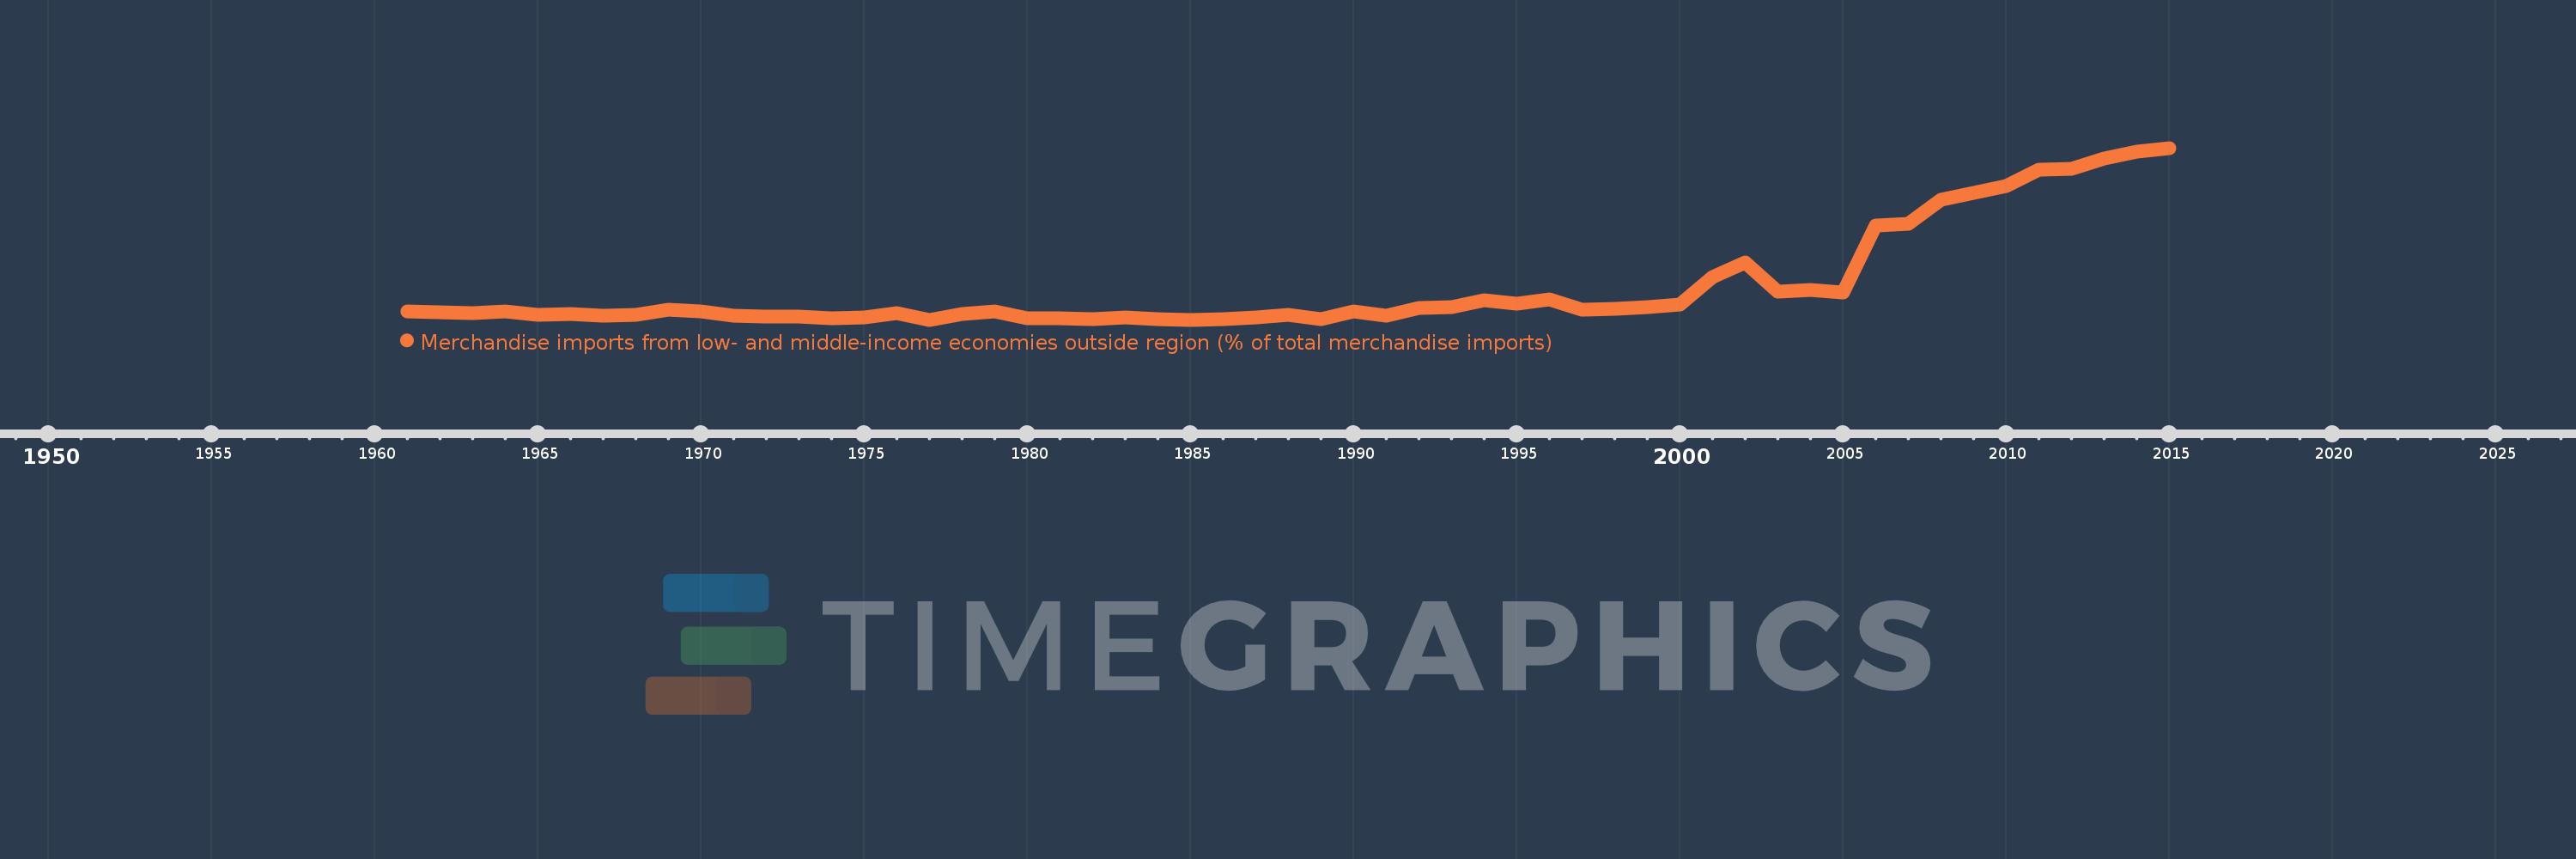
Merchandise imports from low- and middle-income economies outside region (% of total merchandise imports)
2015,2014,2013,2012,2011,2010,2009,2008,2007,2006,2005,2004,2003,2002,2001,2000,1999,1998,1997,1996,1995,1994,1993,1992,1991,1990,1989,1988,1987,1986,1985,1984,1983,1982,1981,1980,1979,1978,1977,1976,1975,1974,1973,1972,1971,1970,1969,1968,1967,1966,1965,1964,1963,1962,1961
Estas estatísticas em outros países:
AfghanistanAlbaniaAlgeriaAngolaArab WorldArgentinaArmeniaArubaAustraliaAustriaAzerbaijanBahamas, TheBahrainBangladeshBarbadosBelarusBelgiumBelizeBeninBermudaBoliviaBrazilBrunei DarussalamBulgariaBurkina FasoBurundiCabo VerdeCambodiaCameroonCanadaCaribbean small statesCentral African RepublicCentral Europe and the BalticsChileChinaColombiaCongo, Dem. Rep.Congo, Rep.Costa RicaCote d'IvoireCroatiaCubaCyprusCzech RepublicDenmarkDominicaDominican RepublicEarly-demographic dividendEast Asia & PacificEast Asia & Pacific (excluding high income)East Asia & Pacific (IDA & IBRD countries)EcuadorEgypt, Arab Rep.El SalvadorEstoniaEthiopiaEuro areaEurope & Central AsiaEurope & Central Asia (excluding high income)Europe & Central Asia (IDA & IBRD countries)European UnionFijiFinlandFragile and conflict affected situationsFranceGabonGambia, TheGeorgiaGermanyGhanaGreeceGreenlandGrenadaGuatemalaGuineaGuyanaHaitiHeavily indebted poor countries (HIPC)High incomeHondurasHong Kong SAR, ChinaHungaryIBRD onlyIcelandIDA & IBRD totalIDA blendIDA onlyIDA totalIndiaIndonesiaIran, Islamic Rep.IraqIrelandIsraelItalyJamaicaJapanJordanKazakhstanKenyaKorea, Dem. People’s Rep.Korea, Rep.KuwaitKyrgyz RepublicLao PDRLate-demographic dividendLatin America & Caribbean Latin America & Caribbean (excluding high income)Latin America & the Caribbean (IDA & IBRD countries)LatviaLeast developed countries: UN classificationLebanonLiberiaLibyaLithuaniaLow & middle incomeLow incomeLower middle incomeLuxembourgMacao SAR, ChinaMacedonia, FYRMadagascarMalawiMalaysiaMaliMaltaMauritaniaMauritiusMexicoMiddle East & North AfricaMiddle East & North Africa (excluding high income)Middle East & North Africa (IDA & IBRD countries)Middle incomeMoldovaMongoliaMontenegroMoroccoMozambiqueMyanmarNetherlandsNew CaledoniaNew ZealandNicaraguaNigerNigeriaNorth AmericaNorwayOECD membersOmanOther small statesPacific island small statesPakistanPanamaPapua New GuineaParaguayPeruPhilippinesPolandPortugalPost-demographic dividendPre-demographic dividendQatarRomaniaRussian FederationRwandaSaudi ArabiaSenegalSerbiaSeychellesSierra LeoneSingaporeSlovak RepublicSloveniaSmall statesSomaliaSouth AfricaSouth AsiaSouth Asia (IDA & IBRD)SpainSri LankaSt. Kitts and NevisSt. LuciaSt. Vincent and the GrenadinesSub-Saharan Africa Sub-Saharan Africa (excluding high income)Sub-Saharan Africa (IDA & IBRD countries)SudanSurinameSwedenSwitzerlandSyrian Arab RepublicTanzaniaThailandTogoTrinidad and TobagoTunisiaTurkeyUgandaUkraineUnited Arab EmiratesUnited KingdomUnited StatesUpper middle incomeUruguayVenezuela, RBVietnamWorldYemen, Rep.ZambiaZimbabwe Linha do tempo:
Nesta escala de tempo está apresentado um gráfico de 1961 ano até 2015 ano Peru. Dados de 1960 ano ausente. O número de observações reais por data: 55.
Fonte (nome):
Indicadores de desenvolvimento mundial
Fonte (organização):
World Bank staff estimates based data from International Monetary Fund's Direction of Trade database.
Categorias:
Private Sector, Trade
Foi atualizado:
23 abr 2017 ano
Indicadores de alterações dos valores ao longo dos anos
Mínimo:
0.705
1 jan 1977 ano
Máximo:
28.715
1 jan 2015 ano
Na data de observação
Valor
Mudança absoluta
A alteração em relação ao valor anterior
1 jan 1961 ano
2.118
+2.118
0.0%
1 jan 1962 ano
1.921
-0.197
-9.32%
1 jan 1963 ano
1.733
-0.188
-9.78%
1 jan 1964 ano
2.083
+0.35
20.21%
1 jan 1965 ano
1.486
-0.597
-28.67%
1 jan 1966 ano
1.591
+0.106
7.11%
1 jan 1967 ano
1.346
-0.245
-15.42%
1 jan 1968 ano
1.438
+0.092
6.86%
1 jan 1969 ano
2.317
+0.879
61.09%
1 jan 1970 ano
2.047
-0.27
-11.64%
1 jan 1971 ano
1.382
-0.666
-32.52%
1 jan 1972 ano
1.192
-0.19
-13.74%
1 jan 1973 ano
1.261
+0.07
5.83%
1 jan 1974 ano
0.89
-0.371
-29.43%
1 jan 1975 ano
1.088
+0.198
22.21%
1 jan 1976 ano
1.798
+0.71
65.3%
1 jan 1977 ano
0.705
-1.093
-60.79%
1 jan 1978 ano
1.635
+0.93
131.85%
1 jan 1979 ano
2.029
+0.394
24.11%
1 jan 1980 ano
0.882
-1.147
-56.52%
1 jan 1981 ano
0.941
+0.058
6.62%
1 jan 1982 ano
0.796
-0.145
-15.39%
1 jan 1983 ano
1.091
+0.295
37.1%
1 jan 1984 ano
0.76
-0.331
-30.35%
1 jan 1985 ano
0.725
-0.035
-4.6%
1 jan 1986 ano
0.823
+0.098
13.53%
1 jan 1987 ano
1.088
+0.265
32.17%
1 jan 1988 ano
1.573
+0.486
44.65%
1 jan 1989 ano
0.798
-0.776
-49.29%
1 jan 1990 ano
2.096
+1.299
162.76%
1 jan 1991 ano
1.372
-0.724
-34.56%
1 jan 1992 ano
2.652
+1.28
93.32%
1 jan 1993 ano
2.78
+0.128
4.82%
1 jan 1994 ano
3.858
+1.078
38.79%
1 jan 1995 ano
3.265
-0.593
-15.38%
1 jan 1996 ano
3.956
+0.691
21.16%
1 jan 1997 ano
2.314
-1.642
-41.51%
1 jan 1998 ano
2.449
+0.135
5.85%
1 jan 1999 ano
2.786
+0.336
13.73%
1 jan 2000 ano
3.196
+0.411
14.75%
1 jan 2001 ano
7.616
+4.419
138.25%
1 jan 2002 ano
10.07
+2.454
32.23%
1 jan 2003 ano
5.234
-4.836
-48.03%
1 jan 2004 ano
5.546
+0.313
5.98%
1 jan 2005 ano
5.192
-0.354
-6.39%
1 jan 2006 ano
16.002
+10.81
208.21%
1 jan 2007 ano
16.344
+0.342
2.14%
1 jan 2008 ano
20.244
+3.9
23.86%
1 jan 2009 ano
21.402
+1.158
5.72%
1 jan 2010 ano
22.458
+1.056
4.93%
1 jan 2011 ano
25.153
+2.695
12.0%
1 jan 2012 ano
25.294
+0.141
0.56%
1 jan 2013 ano
27.034
+1.739
6.88%
1 jan 2014 ano
28.153
+1.12
4.14%
1 jan 2015 ano
28.715
+0.562
2.0%
Classificação de países por estatísticas atuais por anos


Comentários: