29
/pt/
pt
AIzaSyAYiBZKx7MnpbEhh9jyipgxe19OcubqV5w
April 1, 2024
60013
Sub-Saharan Africa (excluding high income)
SSA
false
2
1
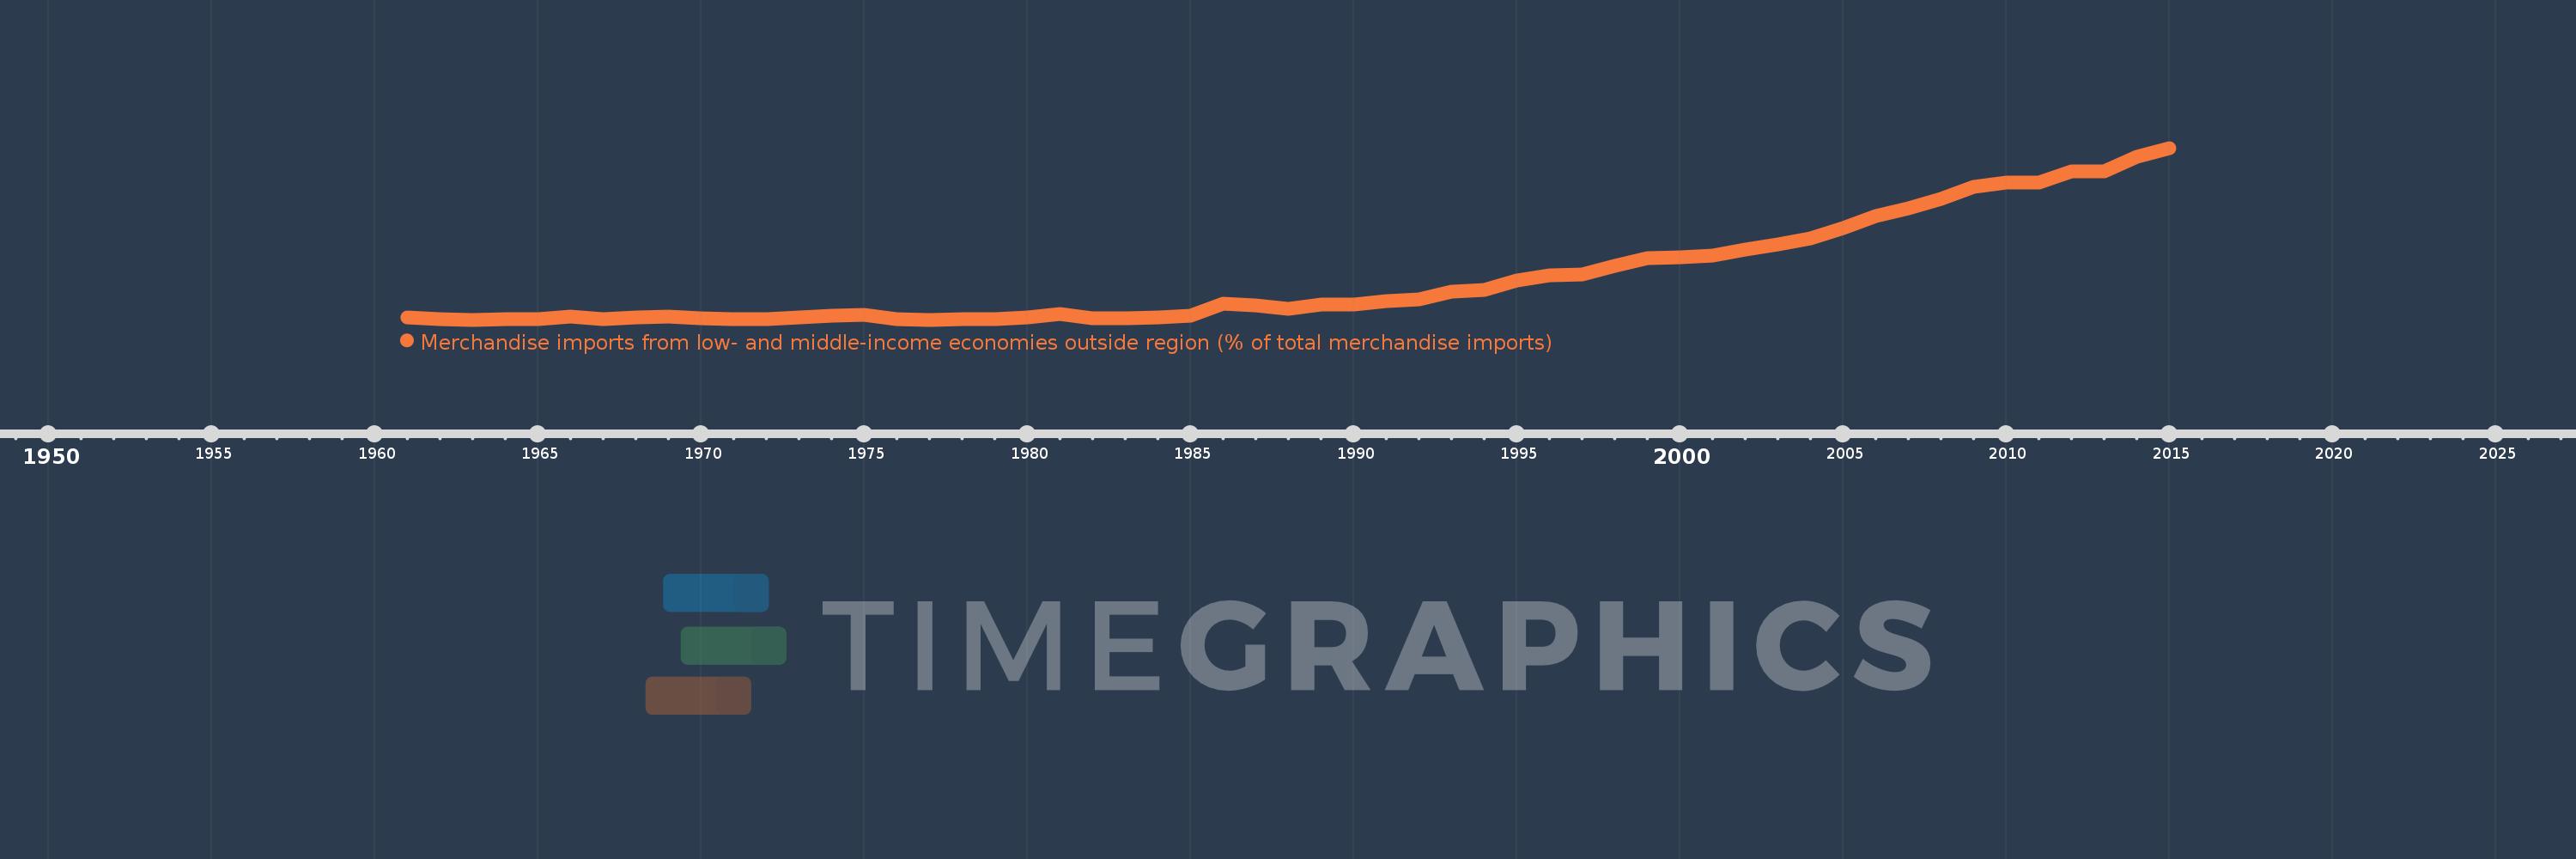
Merchandise imports from low- and middle-income economies outside region (% of total merchandise imports)
2015,2014,2013,2012,2011,2010,2009,2008,2007,2006,2005,2004,2003,2002,2001,2000,1999,1998,1997,1996,1995,1994,1993,1992,1991,1990,1989,1988,1987,1986,1985,1984,1983,1982,1981,1980,1979,1978,1977,1976,1975,1974,1973,1972,1971,1970,1969,1968,1967,1966,1965,1964,1963,1962,1961
Estas estatísticas em outros países:
AfghanistanAlbaniaAlgeriaAngolaArab WorldArgentinaArmeniaArubaAustraliaAustriaAzerbaijanBahamas, TheBahrainBangladeshBarbadosBelarusBelgiumBelizeBeninBermudaBoliviaBrazilBrunei DarussalamBulgariaBurkina FasoBurundiCabo VerdeCambodiaCameroonCanadaCaribbean small statesCentral African RepublicCentral Europe and the BalticsChileChinaColombiaCongo, Dem. Rep.Congo, Rep.Costa RicaCote d'IvoireCroatiaCubaCyprusCzech RepublicDenmarkDominicaDominican RepublicEarly-demographic dividendEast Asia & PacificEast Asia & Pacific (excluding high income)East Asia & Pacific (IDA & IBRD countries)EcuadorEgypt, Arab Rep.El SalvadorEstoniaEthiopiaEuro areaEurope & Central AsiaEurope & Central Asia (excluding high income)Europe & Central Asia (IDA & IBRD countries)European UnionFijiFinlandFragile and conflict affected situationsFranceGabonGambia, TheGeorgiaGermanyGhanaGreeceGreenlandGrenadaGuatemalaGuineaGuyanaHaitiHeavily indebted poor countries (HIPC)High incomeHondurasHong Kong SAR, ChinaHungaryIBRD onlyIcelandIDA & IBRD totalIDA blendIDA onlyIDA totalIndiaIndonesiaIran, Islamic Rep.IraqIrelandIsraelItalyJamaicaJapanJordanKazakhstanKenyaKorea, Dem. People’s Rep.Korea, Rep.KuwaitKyrgyz RepublicLao PDRLate-demographic dividendLatin America & Caribbean Latin America & Caribbean (excluding high income)Latin America & the Caribbean (IDA & IBRD countries)LatviaLeast developed countries: UN classificationLebanonLiberiaLibyaLithuaniaLow & middle incomeLow incomeLower middle incomeLuxembourgMacao SAR, ChinaMacedonia, FYRMadagascarMalawiMalaysiaMaliMaltaMauritaniaMauritiusMexicoMiddle East & North AfricaMiddle East & North Africa (excluding high income)Middle East & North Africa (IDA & IBRD countries)Middle incomeMoldovaMongoliaMontenegroMoroccoMozambiqueMyanmarNetherlandsNew CaledoniaNew ZealandNicaraguaNigerNigeriaNorth AmericaNorwayOECD membersOmanOther small statesPacific island small statesPakistanPanamaPapua New GuineaParaguayPeruPhilippinesPolandPortugalPost-demographic dividendPre-demographic dividendQatarRomaniaRussian FederationRwandaSaudi ArabiaSenegalSerbiaSeychellesSierra LeoneSingaporeSlovak RepublicSloveniaSmall statesSomaliaSouth AfricaSouth AsiaSouth Asia (IDA & IBRD)SpainSri LankaSt. Kitts and NevisSt. LuciaSt. Vincent and the GrenadinesSub-Saharan Africa Sub-Saharan Africa (excluding high income)Sub-Saharan Africa (IDA & IBRD countries)SudanSurinameSwedenSwitzerlandSyrian Arab RepublicTanzaniaThailandTogoTrinidad and TobagoTunisiaTurkeyUgandaUkraineUnited Arab EmiratesUnited KingdomUnited StatesUpper middle incomeUruguayVenezuela, RBVietnamWorldYemen, Rep.ZambiaZimbabwe Linha do tempo:
Nesta escala de tempo está apresentado um gráfico de 1961 ano até 2015 ano Sub-Saharan Africa (excluding high income). Dados de 1960 ano ausente. O número de observações reais por data: 55.
Fonte (nome):
Indicadores de desenvolvimento mundial
Fonte (organização):
World Bank staff estimates based data from International Monetary Fund's Direction of Trade database.
Categorias:
Private Sector, Trade
Foi atualizado:
23 abr 2017 ano
Indicadores de alterações dos valores ao longo dos anos
Máximo:
35.89
1 jan 2015 ano
Na data de observação
Valor
Mudança absoluta
A alteração em relação ao valor anterior
1 jan 1961 ano
1.32
+1.32
0.0%
1 jan 1962 ano
1.004
-0.317
-23.99%
1 jan 1963 ano
0.819
-0.185
-18.41%
1 jan 1964 ano
0.972
+0.153
18.7%
1 jan 1965 ano
0.975
+0.003
0.27%
1 jan 1966 ano
1.459
+0.484
49.7%
1 jan 1967 ano
1.009
-0.45
-30.84%
1 jan 1968 ano
1.267
+0.257
25.52%
1 jan 1969 ano
1.414
+0.147
11.61%
1 jan 1970 ano
1.101
-0.313
-22.13%
1 jan 1971 ano
0.862
-0.239
-21.73%
1 jan 1972 ano
1.01
+0.148
17.21%
1 jan 1973 ano
1.327
+0.317
31.4%
1 jan 1974 ano
1.57
+0.243
18.34%
1 jan 1975 ano
1.763
+0.192
12.25%
1 jan 1976 ano
0.854
-0.908
-51.53%
1 jan 1977 ano
0.8
-0.054
-6.37%
1 jan 1978 ano
0.941
+0.141
17.66%
1 jan 1979 ano
0.986
+0.045
4.73%
1 jan 1980 ano
1.347
+0.361
36.65%
1 jan 1981 ano
2.04
+0.693
51.42%
1 jan 1982 ano
1.103
-0.937
-45.93%
1 jan 1983 ano
1.131
+0.028
2.58%
1 jan 1984 ano
1.3
+0.168
14.88%
1 jan 1985 ano
1.686
+0.386
29.73%
1 jan 1986 ano
3.998
+2.313
137.17%
1 jan 1987 ano
3.684
-0.315
-7.87%
1 jan 1988 ano
2.949
-0.735
-19.95%
1 jan 1989 ano
3.854
+0.905
30.69%
1 jan 1990 ano
3.825
-0.029
-0.76%
1 jan 1991 ano
4.539
+0.715
18.68%
1 jan 1992 ano
4.882
+0.342
7.54%
1 jan 1993 ano
6.621
+1.739
35.63%
1 jan 1994 ano
6.922
+0.301
4.55%
1 jan 1995 ano
8.823
+1.901
27.46%
1 jan 1996 ano
9.877
+1.054
11.95%
1 jan 1997 ano
9.962
+0.085
0.86%
1 jan 1998 ano
11.761
+1.799
18.06%
1 jan 1999 ano
13.343
+1.583
13.46%
1 jan 2000 ano
13.543
+0.199
1.49%
1 jan 2001 ano
13.837
+0.294
2.17%
1 jan 2002 ano
15.183
+1.346
9.73%
1 jan 2003 ano
16.232
+1.049
6.91%
1 jan 2004 ano
17.385
+1.153
7.1%
1 jan 2005 ano
19.558
+2.174
12.5%
1 jan 2006 ano
22.05
+2.491
12.74%
1 jan 2007 ano
23.498
+1.448
6.57%
1 jan 2008 ano
25.469
+1.971
8.39%
1 jan 2009 ano
27.9
+2.431
9.55%
1 jan 2010 ano
28.831
+0.931
3.34%
1 jan 2011 ano
28.854
+0.023
0.08%
1 jan 2012 ano
31.054
+2.2
7.62%
1 jan 2013 ano
31.159
+0.105
0.34%
1 jan 2014 ano
34.007
+2.848
9.14%
1 jan 2015 ano
35.89
+1.883
5.54%
Classificação de países por estatísticas atuais por anos


Comentários: