29
/pt/
pt
AIzaSyAYiBZKx7MnpbEhh9jyipgxe19OcubqV5w
April 1, 2024
257571
Switzerland
CHE
true
2
1
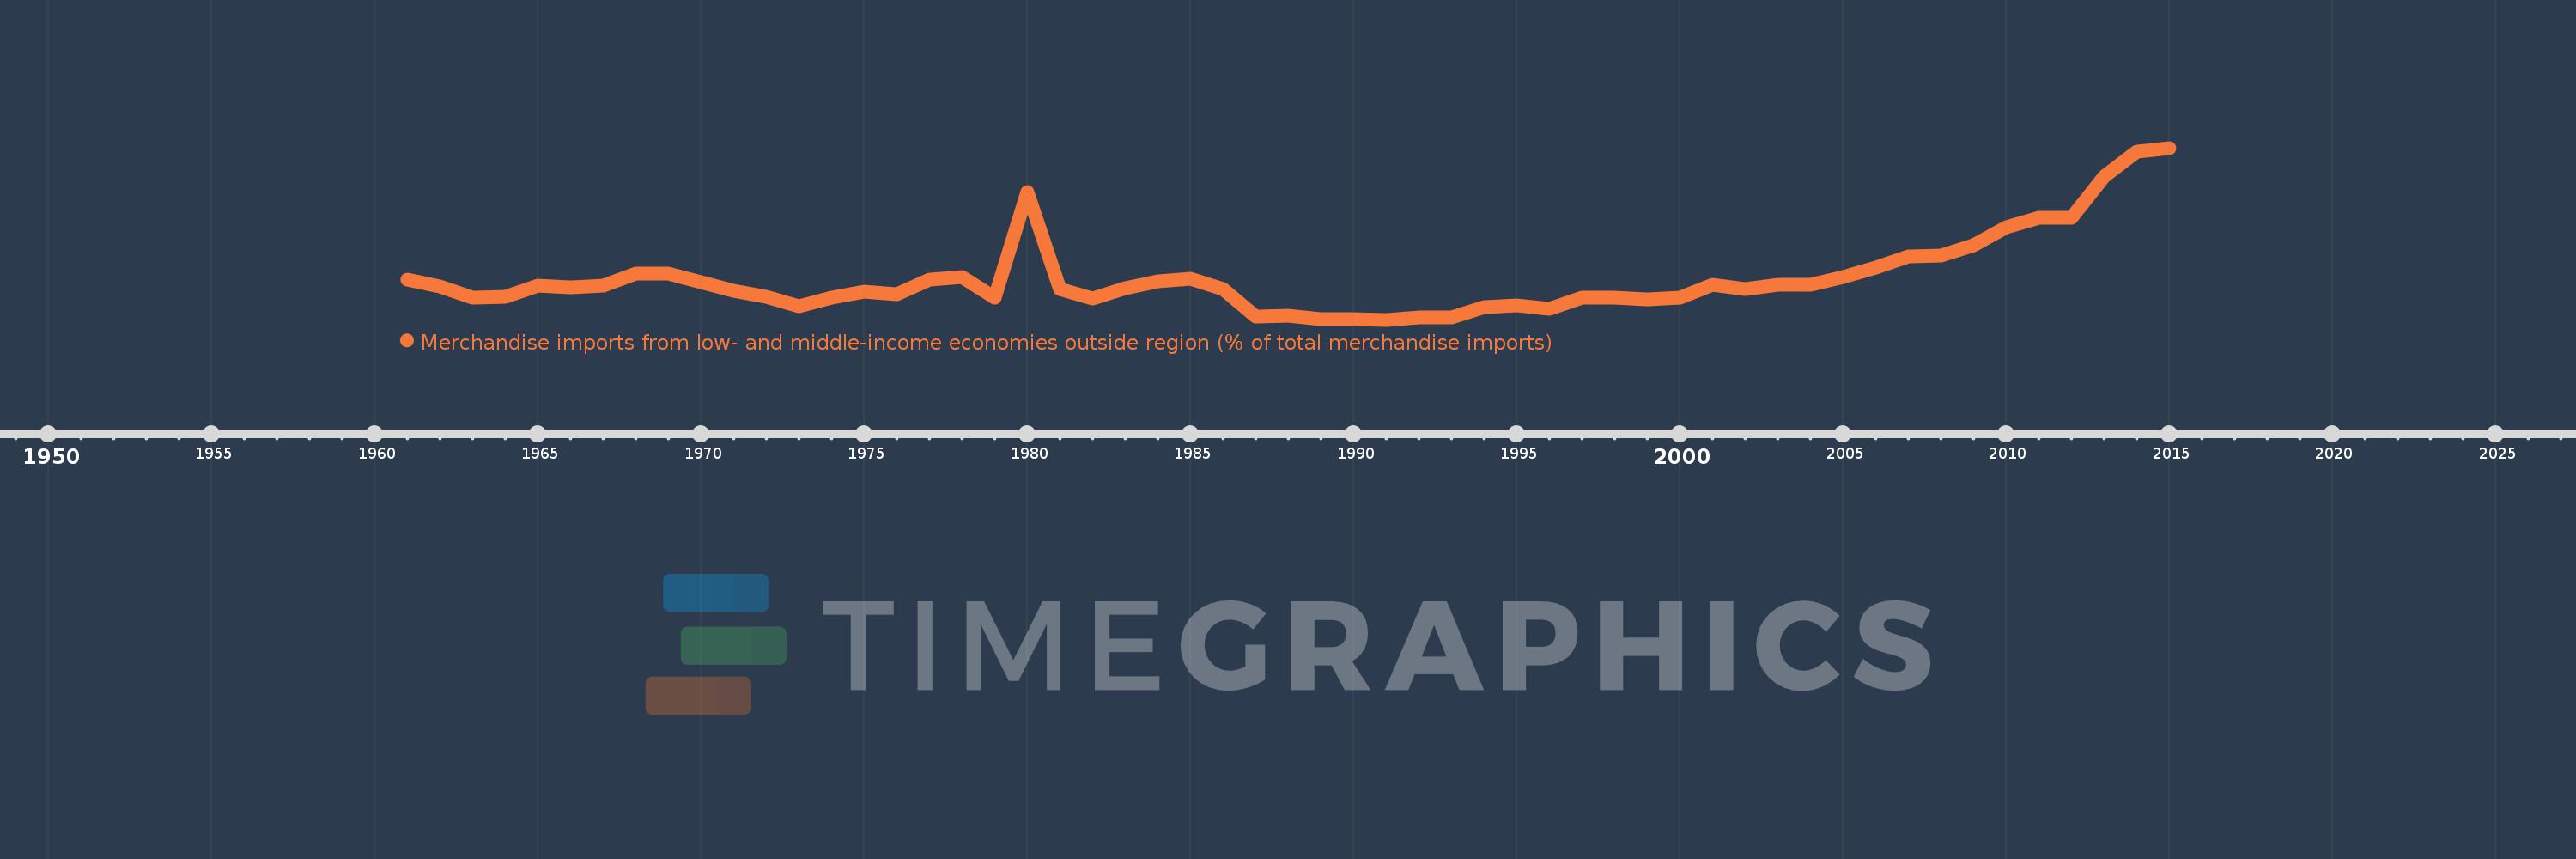
Merchandise imports from low- and middle-income economies outside region (% of total merchandise imports)
2015,2014,2013,2012,2011,2010,2009,2008,2007,2006,2005,2004,2003,2002,2001,2000,1999,1998,1997,1996,1995,1994,1993,1992,1991,1990,1989,1988,1987,1986,1985,1984,1983,1982,1981,1980,1979,1978,1977,1976,1975,1974,1973,1972,1971,1970,1969,1968,1967,1966,1965,1964,1963,1962,1961
Estas estatísticas em outros países:
AfghanistanAlbaniaAlgeriaAngolaArab WorldArgentinaArmeniaArubaAustraliaAustriaAzerbaijanBahamas, TheBahrainBangladeshBarbadosBelarusBelgiumBelizeBeninBermudaBoliviaBrazilBrunei DarussalamBulgariaBurkina FasoBurundiCabo VerdeCambodiaCameroonCanadaCaribbean small statesCentral African RepublicCentral Europe and the BalticsChileChinaColombiaCongo, Dem. Rep.Congo, Rep.Costa RicaCote d'IvoireCroatiaCubaCyprusCzech RepublicDenmarkDominicaDominican RepublicEarly-demographic dividendEast Asia & PacificEast Asia & Pacific (excluding high income)East Asia & Pacific (IDA & IBRD countries)EcuadorEgypt, Arab Rep.El SalvadorEstoniaEthiopiaEuro areaEurope & Central AsiaEurope & Central Asia (excluding high income)Europe & Central Asia (IDA & IBRD countries)European UnionFijiFinlandFragile and conflict affected situationsFranceGabonGambia, TheGeorgiaGermanyGhanaGreeceGreenlandGrenadaGuatemalaGuineaGuyanaHaitiHeavily indebted poor countries (HIPC)High incomeHondurasHong Kong SAR, ChinaHungaryIBRD onlyIcelandIDA & IBRD totalIDA blendIDA onlyIDA totalIndiaIndonesiaIran, Islamic Rep.IraqIrelandIsraelItalyJamaicaJapanJordanKazakhstanKenyaKorea, Dem. People’s Rep.Korea, Rep.KuwaitKyrgyz RepublicLao PDRLate-demographic dividendLatin America & Caribbean Latin America & Caribbean (excluding high income)Latin America & the Caribbean (IDA & IBRD countries)LatviaLeast developed countries: UN classificationLebanonLiberiaLibyaLithuaniaLow & middle incomeLow incomeLower middle incomeLuxembourgMacao SAR, ChinaMacedonia, FYRMadagascarMalawiMalaysiaMaliMaltaMauritaniaMauritiusMexicoMiddle East & North AfricaMiddle East & North Africa (excluding high income)Middle East & North Africa (IDA & IBRD countries)Middle incomeMoldovaMongoliaMontenegroMoroccoMozambiqueMyanmarNetherlandsNew CaledoniaNew ZealandNicaraguaNigerNigeriaNorth AmericaNorwayOECD membersOmanOther small statesPacific island small statesPakistanPanamaPapua New GuineaParaguayPeruPhilippinesPolandPortugalPost-demographic dividendPre-demographic dividendQatarRomaniaRussian FederationRwandaSaudi ArabiaSenegalSerbiaSeychellesSierra LeoneSingaporeSlovak RepublicSloveniaSmall statesSomaliaSouth AfricaSouth AsiaSouth Asia (IDA & IBRD)SpainSri LankaSt. Kitts and NevisSt. LuciaSt. Vincent and the GrenadinesSub-Saharan Africa Sub-Saharan Africa (excluding high income)Sub-Saharan Africa (IDA & IBRD countries)SudanSurinameSwedenSwitzerlandSyrian Arab RepublicTanzaniaThailandTogoTrinidad and TobagoTunisiaTurkeyUgandaUkraineUnited Arab EmiratesUnited KingdomUnited StatesUpper middle incomeUruguayVenezuela, RBVietnamWorldYemen, Rep.ZambiaZimbabwe Linha do tempo:
Nesta escala de tempo está apresentado um gráfico de 1961 ano até 2015 ano Switzerland. Dados de 1960 ano ausente. O número de observações reais por data: 55.
Fonte (nome):
Indicadores de desenvolvimento mundial
Fonte (organização):
World Bank staff estimates based data from International Monetary Fund's Direction of Trade database.
Categorias:
Private Sector, Trade
Foi atualizado:
23 abr 2017 ano
Indicadores de alterações dos valores ao longo dos anos
Mínimo:
4.499
1 jan 1991 ano
Máximo:
14.993
1 jan 2015 ano
Na data de observação
Valor
Mudança absoluta
A alteração em relação ao valor anterior
1 jan 1961 ano
6.972
+6.972
0.0%
1 jan 1962 ano
6.518
-0.454
-6.51%
1 jan 1963 ano
5.842
-0.675
-10.36%
1 jan 1964 ano
5.887
+0.045
0.76%
1 jan 1965 ano
6.569
+0.683
11.6%
1 jan 1966 ano
6.501
-0.069
-1.04%
1 jan 1967 ano
6.568
+0.067
1.04%
1 jan 1968 ano
7.293
+0.725
11.04%
1 jan 1969 ano
7.311
+0.017
0.24%
1 jan 1970 ano
6.78
-0.531
-7.26%
1 jan 1971 ano
6.255
-0.524
-7.73%
1 jan 1972 ano
5.878
-0.378
-6.04%
1 jan 1973 ano
5.346
-0.532
-9.05%
1 jan 1974 ano
5.836
+0.491
9.18%
1 jan 1975 ano
6.199
+0.362
6.21%
1 jan 1976 ano
6.068
-0.131
-2.11%
1 jan 1977 ano
6.943
+0.875
14.42%
1 jan 1978 ano
7.096
+0.153
2.2%
1 jan 1979 ano
5.826
-1.27
-17.9%
1 jan 1980 ano
12.32
+6.495
111.48%
1 jan 1981 ano
6.351
-5.969
-48.45%
1 jan 1982 ano
5.813
-0.538
-8.47%
1 jan 1983 ano
6.429
+0.616
10.6%
1 jan 1984 ano
6.841
+0.413
6.42%
1 jan 1985 ano
7.004
+0.162
2.37%
1 jan 1986 ano
6.36
-0.644
-9.19%
1 jan 1987 ano
4.704
-1.656
-26.04%
1 jan 1988 ano
4.735
+0.031
0.66%
1 jan 1989 ano
4.54
-0.195
-4.12%
1 jan 1990 ano
4.54
+0.0
0.01%
1 jan 1991 ano
4.499
-0.041
-0.89%
1 jan 1992 ano
4.648
+0.148
3.29%
1 jan 1993 ano
4.638
-0.009
-0.2%
1 jan 1994 ano
5.245
+0.607
13.08%
1 jan 1995 ano
5.371
+0.126
2.4%
1 jan 1996 ano
5.179
-0.192
-3.57%
1 jan 1997 ano
5.866
+0.687
13.27%
1 jan 1998 ano
5.826
-0.04
-0.69%
1 jan 1999 ano
5.766
-0.059
-1.02%
1 jan 2000 ano
5.86
+0.094
1.63%
1 jan 2001 ano
6.66
+0.8
13.65%
1 jan 2002 ano
6.392
-0.268
-4.03%
1 jan 2003 ano
6.638
+0.246
3.84%
1 jan 2004 ano
6.66
+0.022
0.33%
1 jan 2005 ano
7.087
+0.427
6.41%
1 jan 2006 ano
7.668
+0.581
8.2%
1 jan 2007 ano
8.349
+0.681
8.88%
1 jan 2008 ano
8.424
+0.076
0.9%
1 jan 2009 ano
9.063
+0.639
7.58%
1 jan 2010 ano
10.155
+1.092
12.05%
1 jan 2011 ano
10.716
+0.561
5.52%
1 jan 2012 ano
10.717
+0.001
0.01%
1 jan 2013 ano
13.23
+2.513
23.45%
1 jan 2014 ano
14.782
+1.553
11.74%
1 jan 2015 ano
14.993
+0.211
1.43%
Classificação de países por estatísticas atuais por anos


Comentários: