29
/pt/
pt
AIzaSyAYiBZKx7MnpbEhh9jyipgxe19OcubqV5w
April 1, 2024
62806
World
WLD
false
2
1
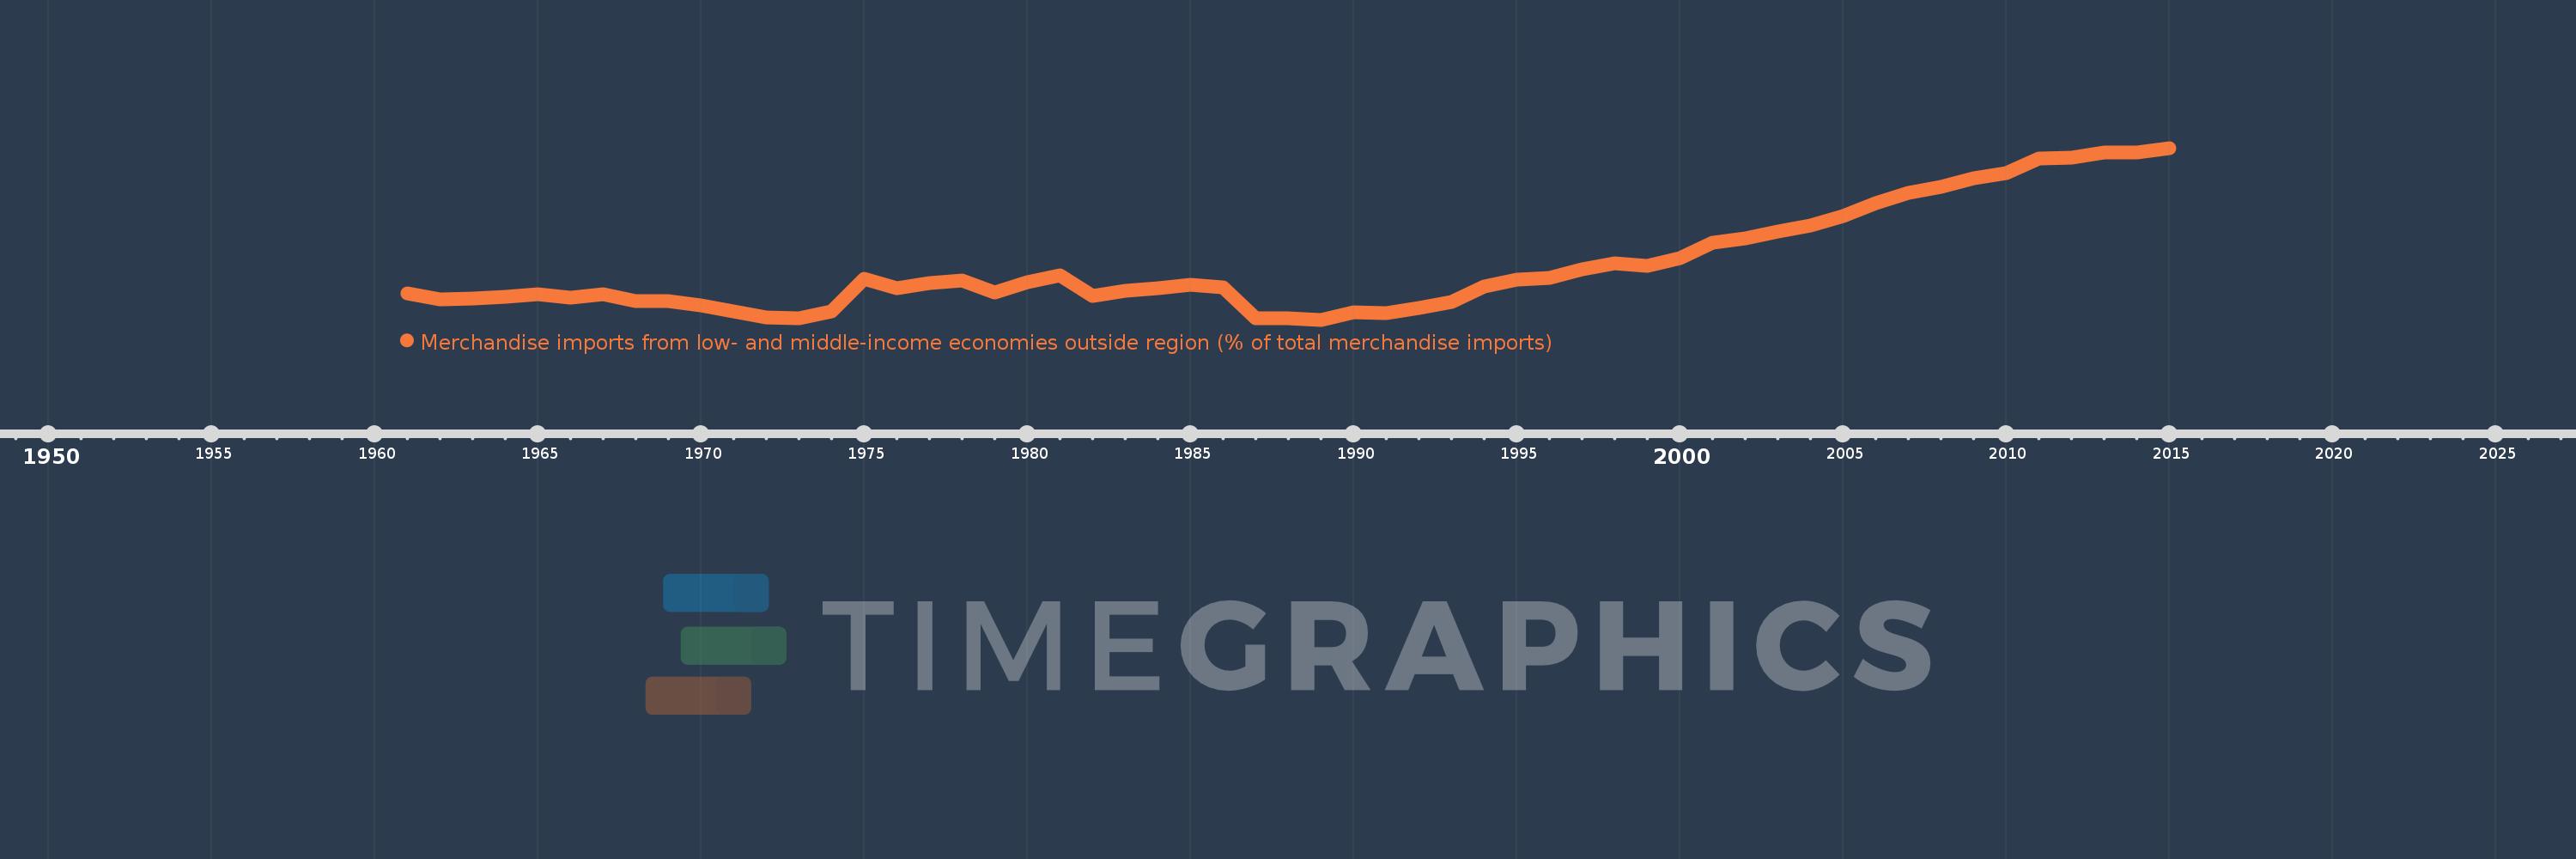
Merchandise imports from low- and middle-income economies outside region (% of total merchandise imports)
2015,2014,2013,2012,2011,2010,2009,2008,2007,2006,2005,2004,2003,2002,2001,2000,1999,1998,1997,1996,1995,1994,1993,1992,1991,1990,1989,1988,1987,1986,1985,1984,1983,1982,1981,1980,1979,1978,1977,1976,1975,1974,1973,1972,1971,1970,1969,1968,1967,1966,1965,1964,1963,1962,1961
Estas estatísticas em outros países:
AfghanistanAlbaniaAlgeriaAngolaArab WorldArgentinaArmeniaArubaAustraliaAustriaAzerbaijanBahamas, TheBahrainBangladeshBarbadosBelarusBelgiumBelizeBeninBermudaBoliviaBrazilBrunei DarussalamBulgariaBurkina FasoBurundiCabo VerdeCambodiaCameroonCanadaCaribbean small statesCentral African RepublicCentral Europe and the BalticsChileChinaColombiaCongo, Dem. Rep.Congo, Rep.Costa RicaCote d'IvoireCroatiaCubaCyprusCzech RepublicDenmarkDominicaDominican RepublicEarly-demographic dividendEast Asia & PacificEast Asia & Pacific (excluding high income)East Asia & Pacific (IDA & IBRD countries)EcuadorEgypt, Arab Rep.El SalvadorEstoniaEthiopiaEuro areaEurope & Central AsiaEurope & Central Asia (excluding high income)Europe & Central Asia (IDA & IBRD countries)European UnionFijiFinlandFragile and conflict affected situationsFranceGabonGambia, TheGeorgiaGermanyGhanaGreeceGreenlandGrenadaGuatemalaGuineaGuyanaHaitiHeavily indebted poor countries (HIPC)High incomeHondurasHong Kong SAR, ChinaHungaryIBRD onlyIcelandIDA & IBRD totalIDA blendIDA onlyIDA totalIndiaIndonesiaIran, Islamic Rep.IraqIrelandIsraelItalyJamaicaJapanJordanKazakhstanKenyaKorea, Dem. People’s Rep.Korea, Rep.KuwaitKyrgyz RepublicLao PDRLate-demographic dividendLatin America & Caribbean Latin America & Caribbean (excluding high income)Latin America & the Caribbean (IDA & IBRD countries)LatviaLeast developed countries: UN classificationLebanonLiberiaLibyaLithuaniaLow & middle incomeLow incomeLower middle incomeLuxembourgMacao SAR, ChinaMacedonia, FYRMadagascarMalawiMalaysiaMaliMaltaMauritaniaMauritiusMexicoMiddle East & North AfricaMiddle East & North Africa (excluding high income)Middle East & North Africa (IDA & IBRD countries)Middle incomeMoldovaMongoliaMontenegroMoroccoMozambiqueMyanmarNetherlandsNew CaledoniaNew ZealandNicaraguaNigerNigeriaNorth AmericaNorwayOECD membersOmanOther small statesPacific island small statesPakistanPanamaPapua New GuineaParaguayPeruPhilippinesPolandPortugalPost-demographic dividendPre-demographic dividendQatarRomaniaRussian FederationRwandaSaudi ArabiaSenegalSerbiaSeychellesSierra LeoneSingaporeSlovak RepublicSloveniaSmall statesSomaliaSouth AfricaSouth AsiaSouth Asia (IDA & IBRD)SpainSri LankaSt. Kitts and NevisSt. LuciaSt. Vincent and the GrenadinesSub-Saharan Africa Sub-Saharan Africa (excluding high income)Sub-Saharan Africa (IDA & IBRD countries)SudanSurinameSwedenSwitzerlandSyrian Arab RepublicTanzaniaThailandTogoTrinidad and TobagoTunisiaTurkeyUgandaUkraineUnited Arab EmiratesUnited KingdomUnited StatesUpper middle incomeUruguayVenezuela, RBVietnamWorldYemen, Rep.ZambiaZimbabwe Linha do tempo:
Nesta escala de tempo está apresentado um gráfico de 1961 ano até 2015 ano World. Dados de 1960 ano ausente. O número de observações reais por data: 55.
Fonte (nome):
Indicadores de desenvolvimento mundial
Fonte (organização):
World Bank staff estimates based data from International Monetary Fund's Direction of Trade database.
Categorias:
Private Sector, Trade
Foi atualizado:
23 abr 2017 ano
Indicadores de alterações dos valores ao longo dos anos
Mínimo:
12.628
1 jan 1989 ano
Máximo:
27.831
1 jan 2015 ano
Na data de observação
Valor
Mudança absoluta
A alteração em relação ao valor anterior
1 jan 1961 ano
14.988
+14.988
0.0%
1 jan 1962 ano
14.442
-0.546
-3.64%
1 jan 1963 ano
14.53
+0.087
0.6%
1 jan 1964 ano
14.652
+0.122
0.84%
1 jan 1965 ano
14.922
+0.27
1.84%
1 jan 1966 ano
14.589
-0.333
-2.23%
1 jan 1967 ano
14.867
+0.278
1.91%
1 jan 1968 ano
14.264
-0.603
-4.05%
1 jan 1969 ano
14.255
-0.009
-0.06%
1 jan 1970 ano
13.926
-0.329
-2.31%
1 jan 1971 ano
13.389
-0.536
-3.85%
1 jan 1972 ano
12.858
-0.532
-3.97%
1 jan 1973 ano
12.746
-0.112
-0.87%
1 jan 1974 ano
13.398
+0.653
5.12%
1 jan 1975 ano
16.249
+2.851
21.28%
1 jan 1976 ano
15.388
-0.861
-5.3%
1 jan 1977 ano
15.84
+0.451
2.93%
1 jan 1978 ano
16.094
+0.254
1.6%
1 jan 1979 ano
15.035
-1.059
-6.58%
1 jan 1980 ano
15.981
+0.947
6.3%
1 jan 1981 ano
16.594
+0.612
3.83%
1 jan 1982 ano
14.76
-1.834
-11.05%
1 jan 1983 ano
15.172
+0.412
2.79%
1 jan 1984 ano
15.387
+0.215
1.41%
1 jan 1985 ano
15.686
+0.299
1.95%
1 jan 1986 ano
15.492
-0.194
-1.24%
1 jan 1987 ano
12.764
-2.728
-17.61%
1 jan 1988 ano
12.763
-0.002
-0.01%
1 jan 1989 ano
12.628
-0.135
-1.06%
1 jan 1990 ano
13.263
+0.635
5.03%
1 jan 1991 ano
13.244
-0.019
-0.14%
1 jan 1992 ano
13.657
+0.413
3.12%
1 jan 1993 ano
14.208
+0.55
4.03%
1 jan 1994 ano
15.602
+1.394
9.81%
1 jan 1995 ano
16.213
+0.611
3.92%
1 jan 1996 ano
16.313
+0.1
0.62%
1 jan 1997 ano
17.117
+0.804
4.93%
1 jan 1998 ano
17.611
+0.493
2.88%
1 jan 1999 ano
17.424
-0.187
-1.06%
1 jan 2000 ano
18.08
+0.656
3.76%
1 jan 2001 ano
19.449
+1.37
7.57%
1 jan 2002 ano
19.792
+0.343
1.76%
1 jan 2003 ano
20.408
+0.616
3.11%
1 jan 2004 ano
20.998
+0.59
2.89%
1 jan 2005 ano
21.793
+0.794
3.78%
1 jan 2006 ano
22.952
+1.159
5.32%
1 jan 2007 ano
23.864
+0.913
3.98%
1 jan 2008 ano
24.379
+0.515
2.16%
1 jan 2009 ano
25.119
+0.739
3.03%
1 jan 2010 ano
25.582
+0.463
1.84%
1 jan 2011 ano
26.872
+1.29
5.04%
1 jan 2012 ano
26.972
+0.101
0.37%
1 jan 2013 ano
27.422
+0.45
1.67%
1 jan 2014 ano
27.406
-0.016
-0.06%
1 jan 2015 ano
27.831
+0.425
1.55%
Classificação de países por estatísticas atuais por anos


Comentários: