29
/pt/
pt
AIzaSyAYiBZKx7MnpbEhh9jyipgxe19OcubqV5w
April 1, 2024
49232
Middle East & North Africa (excluding high income)
MNA
false
2
1
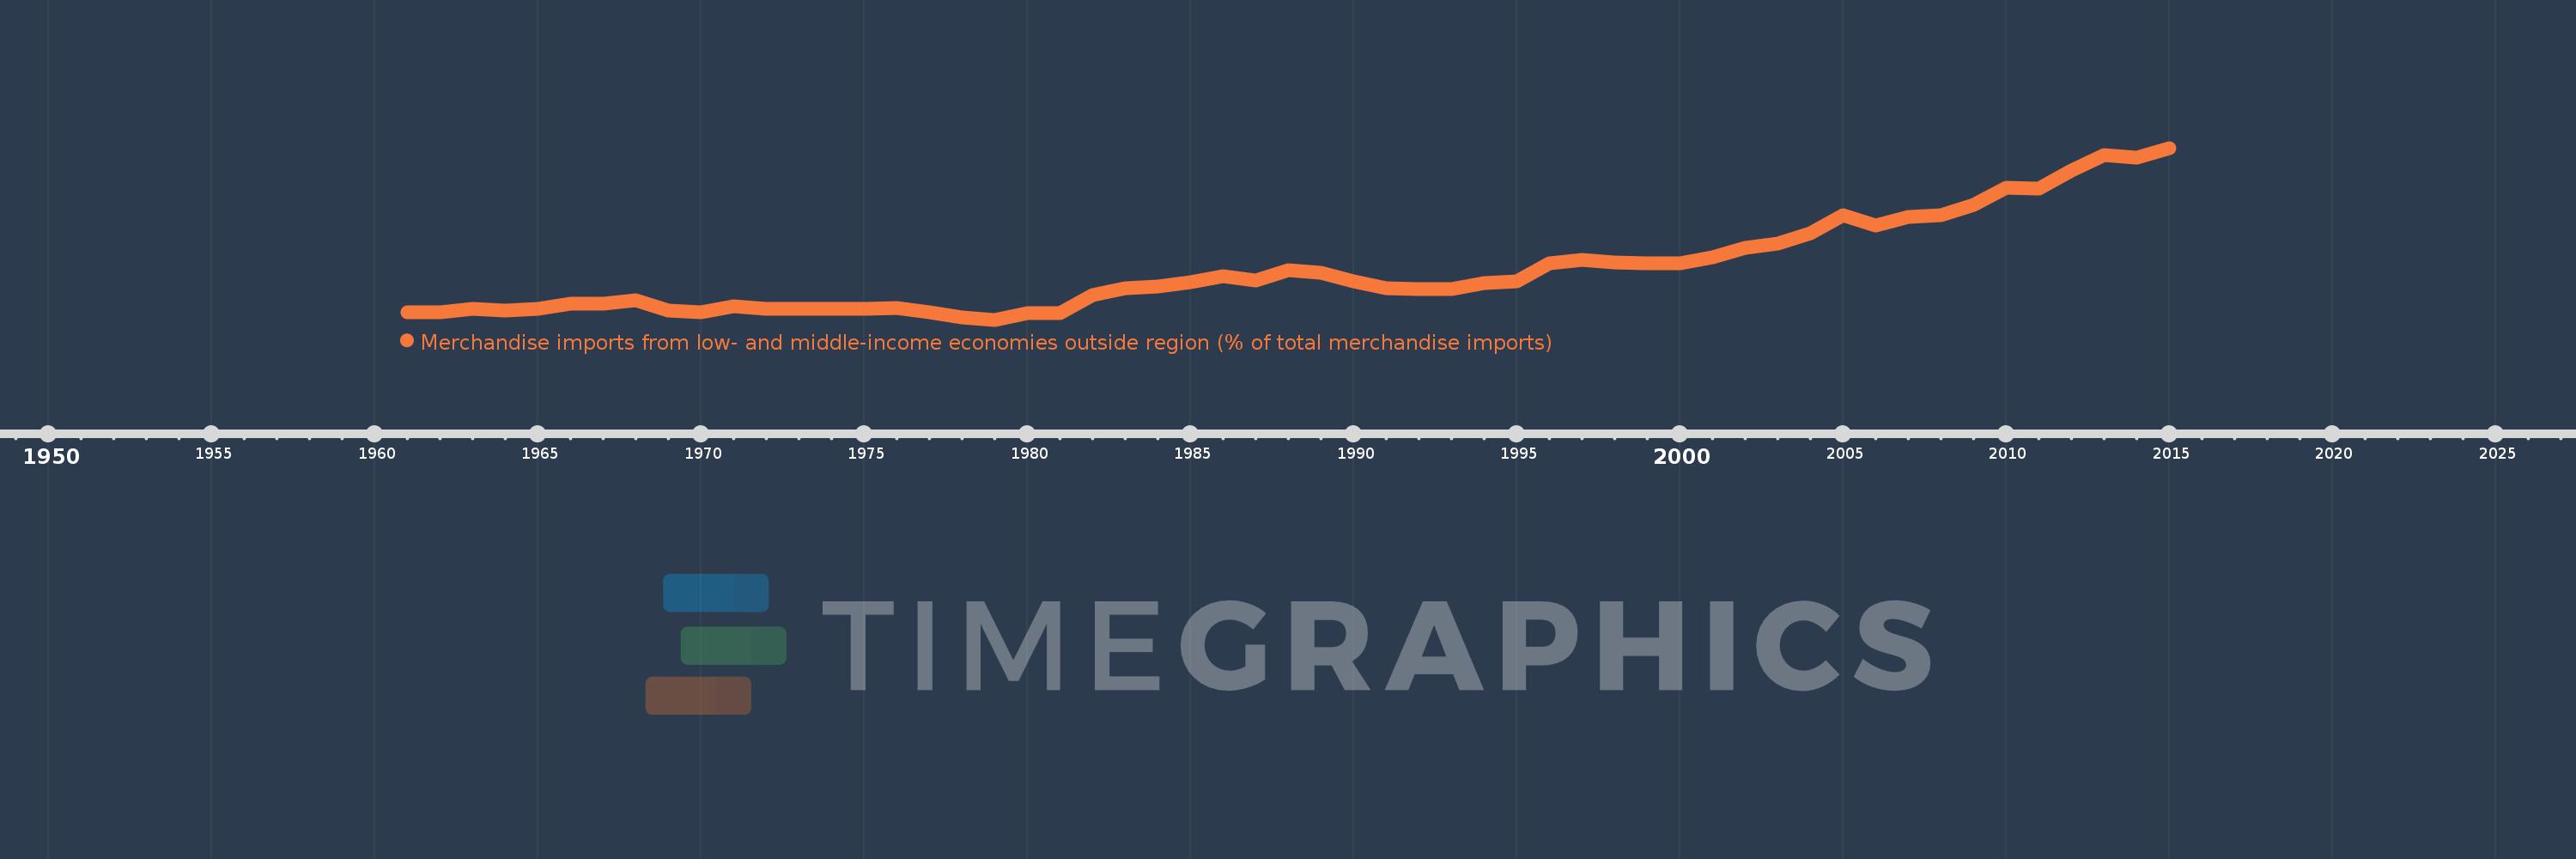
Merchandise imports from low- and middle-income economies outside region (% of total merchandise imports)
2015,2014,2013,2012,2011,2010,2009,2008,2007,2006,2005,2004,2003,2002,2001,2000,1999,1998,1997,1996,1995,1994,1993,1992,1991,1990,1989,1988,1987,1986,1985,1984,1983,1982,1981,1980,1979,1978,1977,1976,1975,1974,1973,1972,1971,1970,1969,1968,1967,1966,1965,1964,1963,1962,1961
Estas estatísticas em outros países:
AfghanistanAlbaniaAlgeriaAngolaArab WorldArgentinaArmeniaArubaAustraliaAustriaAzerbaijanBahamas, TheBahrainBangladeshBarbadosBelarusBelgiumBelizeBeninBermudaBoliviaBrazilBrunei DarussalamBulgariaBurkina FasoBurundiCabo VerdeCambodiaCameroonCanadaCaribbean small statesCentral African RepublicCentral Europe and the BalticsChileChinaColombiaCongo, Dem. Rep.Congo, Rep.Costa RicaCote d'IvoireCroatiaCubaCyprusCzech RepublicDenmarkDominicaDominican RepublicEarly-demographic dividendEast Asia & PacificEast Asia & Pacific (excluding high income)East Asia & Pacific (IDA & IBRD countries)EcuadorEgypt, Arab Rep.El SalvadorEstoniaEthiopiaEuro areaEurope & Central AsiaEurope & Central Asia (excluding high income)Europe & Central Asia (IDA & IBRD countries)European UnionFijiFinlandFragile and conflict affected situationsFranceGabonGambia, TheGeorgiaGermanyGhanaGreeceGreenlandGrenadaGuatemalaGuineaGuyanaHaitiHeavily indebted poor countries (HIPC)High incomeHondurasHong Kong SAR, ChinaHungaryIBRD onlyIcelandIDA & IBRD totalIDA blendIDA onlyIDA totalIndiaIndonesiaIran, Islamic Rep.IraqIrelandIsraelItalyJamaicaJapanJordanKazakhstanKenyaKorea, Dem. People’s Rep.Korea, Rep.KuwaitKyrgyz RepublicLao PDRLate-demographic dividendLatin America & Caribbean Latin America & Caribbean (excluding high income)Latin America & the Caribbean (IDA & IBRD countries)LatviaLeast developed countries: UN classificationLebanonLiberiaLibyaLithuaniaLow & middle incomeLow incomeLower middle incomeLuxembourgMacao SAR, ChinaMacedonia, FYRMadagascarMalawiMalaysiaMaliMaltaMauritaniaMauritiusMexicoMiddle East & North AfricaMiddle East & North Africa (excluding high income)Middle East & North Africa (IDA & IBRD countries)Middle incomeMoldovaMongoliaMontenegroMoroccoMozambiqueMyanmarNetherlandsNew CaledoniaNew ZealandNicaraguaNigerNigeriaNorth AmericaNorwayOECD membersOmanOther small statesPacific island small statesPakistanPanamaPapua New GuineaParaguayPeruPhilippinesPolandPortugalPost-demographic dividendPre-demographic dividendQatarRomaniaRussian FederationRwandaSaudi ArabiaSenegalSerbiaSeychellesSierra LeoneSingaporeSlovak RepublicSloveniaSmall statesSomaliaSouth AfricaSouth AsiaSouth Asia (IDA & IBRD)SpainSri LankaSt. Kitts and NevisSt. LuciaSt. Vincent and the GrenadinesSub-Saharan Africa Sub-Saharan Africa (excluding high income)Sub-Saharan Africa (IDA & IBRD countries)SudanSurinameSwedenSwitzerlandSyrian Arab RepublicTanzaniaThailandTogoTrinidad and TobagoTunisiaTurkeyUgandaUkraineUnited Arab EmiratesUnited KingdomUnited StatesUpper middle incomeUruguayVenezuela, RBVietnamWorldYemen, Rep.ZambiaZimbabwe Linha do tempo:
Nesta escala de tempo está apresentado um gráfico de 1961 ano até 2015 ano Middle East & North Africa (excluding high income). Dados de 1960 ano ausente. O número de observações reais por data: 55.
Fonte (nome):
Indicadores de desenvolvimento mundial
Fonte (organização):
World Bank staff estimates based data from International Monetary Fund's Direction of Trade database.
Categorias:
Private Sector, Trade
Foi atualizado:
23 abr 2017 ano
Indicadores de alterações dos valores ao longo dos anos
Mínimo:
4.809
1 jan 1979 ano
Máximo:
33.167
1 jan 2015 ano
Na data de observação
Valor
Mudança absoluta
A alteração em relação ao valor anterior
1 jan 1961 ano
6.04
+6.04
0.0%
1 jan 1962 ano
6.051
+0.011
0.19%
1 jan 1963 ano
6.659
+0.607
10.04%
1 jan 1964 ano
6.306
-0.353
-5.3%
1 jan 1965 ano
6.557
+0.252
3.99%
1 jan 1966 ano
7.407
+0.85
12.96%
1 jan 1967 ano
7.46
+0.053
0.72%
1 jan 1968 ano
8.012
+0.552
7.4%
1 jan 1969 ano
6.29
-1.722
-21.49%
1 jan 1970 ano
6.007
-0.282
-4.49%
1 jan 1971 ano
7.085
+1.078
17.94%
1 jan 1972 ano
6.646
-0.439
-6.2%
1 jan 1973 ano
6.561
-0.085
-1.28%
1 jan 1974 ano
6.669
+0.108
1.64%
1 jan 1975 ano
6.665
-0.004
-0.06%
1 jan 1976 ano
6.785
+0.12
1.81%
1 jan 1977 ano
6.019
-0.766
-11.29%
1 jan 1978 ano
5.19
-0.829
-13.77%
1 jan 1979 ano
4.809
-0.381
-7.33%
1 jan 1980 ano
5.843
+1.034
21.5%
1 jan 1981 ano
5.971
+0.128
2.19%
1 jan 1982 ano
8.829
+2.857
47.85%
1 jan 1983 ano
10.006
+1.177
13.33%
1 jan 1984 ano
10.357
+0.351
3.51%
1 jan 1985 ano
11.023
+0.666
6.43%
1 jan 1986 ano
12.054
+1.031
9.35%
1 jan 1987 ano
11.304
-0.75
-6.22%
1 jan 1988 ano
12.977
+1.673
14.8%
1 jan 1989 ano
12.628
-0.35
-2.69%
1 jan 1990 ano
11.216
-1.412
-11.18%
1 jan 1991 ano
9.952
-1.264
-11.27%
1 jan 1992 ano
9.818
-0.134
-1.34%
1 jan 1993 ano
9.82
+0.002
0.02%
1 jan 1994 ano
10.819
+0.999
10.17%
1 jan 1995 ano
11.198
+0.379
3.5%
1 jan 1996 ano
14.19
+2.993
26.73%
1 jan 1997 ano
14.75
+0.56
3.95%
1 jan 1998 ano
14.25
-0.5
-3.39%
1 jan 1999 ano
14.078
-0.172
-1.2%
1 jan 2000 ano
14.157
+0.079
0.56%
1 jan 2001 ano
15.147
+0.989
6.99%
1 jan 2002 ano
16.68
+1.533
10.12%
1 jan 2003 ano
17.392
+0.712
4.27%
1 jan 2004 ano
19.027
+1.635
9.4%
1 jan 2005 ano
22.099
+3.072
16.15%
1 jan 2006 ano
20.334
-1.765
-7.99%
1 jan 2007 ano
21.768
+1.433
7.05%
1 jan 2008 ano
22.042
+0.275
1.26%
1 jan 2009 ano
23.77
+1.728
7.84%
1 jan 2010 ano
26.671
+2.901
12.2%
1 jan 2011 ano
26.432
-0.239
-0.9%
1 jan 2012 ano
29.452
+3.02
11.43%
1 jan 2013 ano
31.962
+2.51
8.52%
1 jan 2014 ano
31.57
-0.392
-1.23%
1 jan 2015 ano
33.167
+1.597
5.06%
Classificação de países por estatísticas atuais por anos


Comentários: