29
/pt/
pt
AIzaSyAYiBZKx7MnpbEhh9jyipgxe19OcubqV5w
April 1, 2024
101350
Canada
CAN
true
2
1
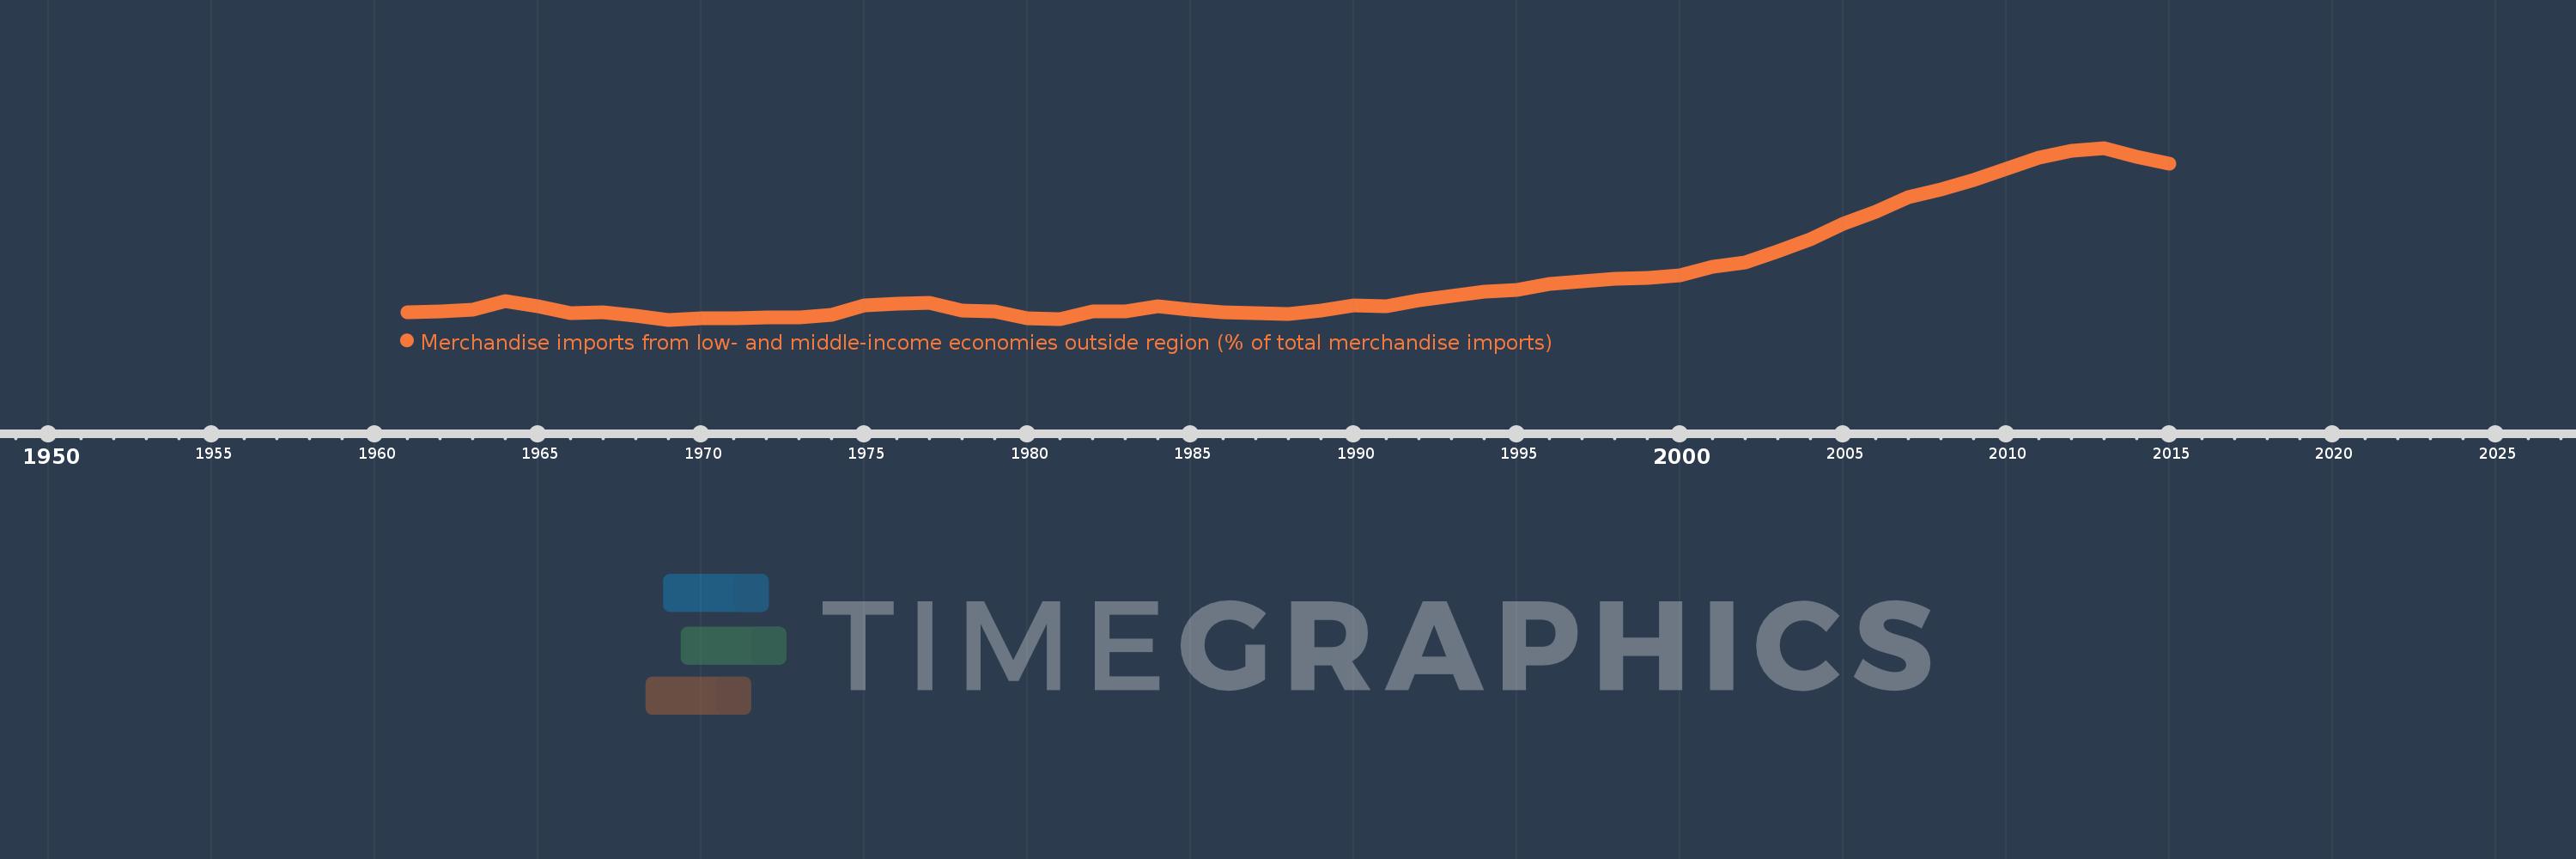
Merchandise imports from low- and middle-income economies outside region (% of total merchandise imports)
2015,2014,2013,2012,2011,2010,2009,2008,2007,2006,2005,2004,2003,2002,2001,2000,1999,1998,1997,1996,1995,1994,1993,1992,1991,1990,1989,1988,1987,1986,1985,1984,1983,1982,1981,1980,1979,1978,1977,1976,1975,1974,1973,1972,1971,1970,1969,1968,1967,1966,1965,1964,1963,1962,1961
Estas estatísticas em outros países:
AfghanistanAlbaniaAlgeriaAngolaArab WorldArgentinaArmeniaArubaAustraliaAustriaAzerbaijanBahamas, TheBahrainBangladeshBarbadosBelarusBelgiumBelizeBeninBermudaBoliviaBrazilBrunei DarussalamBulgariaBurkina FasoBurundiCabo VerdeCambodiaCameroonCanadaCaribbean small statesCentral African RepublicCentral Europe and the BalticsChileChinaColombiaCongo, Dem. Rep.Congo, Rep.Costa RicaCote d'IvoireCroatiaCubaCyprusCzech RepublicDenmarkDominicaDominican RepublicEarly-demographic dividendEast Asia & PacificEast Asia & Pacific (excluding high income)East Asia & Pacific (IDA & IBRD countries)EcuadorEgypt, Arab Rep.El SalvadorEstoniaEthiopiaEuro areaEurope & Central AsiaEurope & Central Asia (excluding high income)Europe & Central Asia (IDA & IBRD countries)European UnionFijiFinlandFragile and conflict affected situationsFranceGabonGambia, TheGeorgiaGermanyGhanaGreeceGreenlandGrenadaGuatemalaGuineaGuyanaHaitiHeavily indebted poor countries (HIPC)High incomeHondurasHong Kong SAR, ChinaHungaryIBRD onlyIcelandIDA & IBRD totalIDA blendIDA onlyIDA totalIndiaIndonesiaIran, Islamic Rep.IraqIrelandIsraelItalyJamaicaJapanJordanKazakhstanKenyaKorea, Dem. People’s Rep.Korea, Rep.KuwaitKyrgyz RepublicLao PDRLate-demographic dividendLatin America & Caribbean Latin America & Caribbean (excluding high income)Latin America & the Caribbean (IDA & IBRD countries)LatviaLeast developed countries: UN classificationLebanonLiberiaLibyaLithuaniaLow & middle incomeLow incomeLower middle incomeLuxembourgMacao SAR, ChinaMacedonia, FYRMadagascarMalawiMalaysiaMaliMaltaMauritaniaMauritiusMexicoMiddle East & North AfricaMiddle East & North Africa (excluding high income)Middle East & North Africa (IDA & IBRD countries)Middle incomeMoldovaMongoliaMontenegroMoroccoMozambiqueMyanmarNetherlandsNew CaledoniaNew ZealandNicaraguaNigerNigeriaNorth AmericaNorwayOECD membersOmanOther small statesPacific island small statesPakistanPanamaPapua New GuineaParaguayPeruPhilippinesPolandPortugalPost-demographic dividendPre-demographic dividendQatarRomaniaRussian FederationRwandaSaudi ArabiaSenegalSerbiaSeychellesSierra LeoneSingaporeSlovak RepublicSloveniaSmall statesSomaliaSouth AfricaSouth AsiaSouth Asia (IDA & IBRD)SpainSri LankaSt. Kitts and NevisSt. LuciaSt. Vincent and the GrenadinesSub-Saharan Africa Sub-Saharan Africa (excluding high income)Sub-Saharan Africa (IDA & IBRD countries)SudanSurinameSwedenSwitzerlandSyrian Arab RepublicTanzaniaThailandTogoTrinidad and TobagoTunisiaTurkeyUgandaUkraineUnited Arab EmiratesUnited KingdomUnited StatesUpper middle incomeUruguayVenezuela, RBVietnamWorldYemen, Rep.ZambiaZimbabwe Linha do tempo:
Nesta escala de tempo está apresentado um gráfico de 1961 ano até 2015 ano Canada. Dados de 1960 ano ausente. O número de observações reais por data: 55.
Fonte (nome):
Indicadores de desenvolvimento mundial
Fonte (organização):
World Bank staff estimates based data from International Monetary Fund's Direction of Trade database.
Categorias:
Private Sector, Trade
Foi atualizado:
23 abr 2017 ano
Indicadores de alterações dos valores ao longo dos anos
Mínimo:
3.879
1 jan 1969 ano
Máximo:
27.354
1 jan 2013 ano
Na data de observação
Valor
Mudança absoluta
A alteração em relação ao valor anterior
1 jan 1961 ano
4.927
+4.927
0.0%
1 jan 1962 ano
5.011
+0.084
1.7%
1 jan 1963 ano
5.23
+0.219
4.38%
1 jan 1964 ano
6.407
+1.176
22.49%
1 jan 1965 ano
5.664
-0.743
-11.6%
1 jan 1966 ano
4.727
-0.937
-16.54%
1 jan 1967 ano
4.91
+0.183
3.87%
1 jan 1968 ano
4.447
-0.463
-9.44%
1 jan 1969 ano
3.879
-0.567
-12.76%
1 jan 1970 ano
4.032
+0.153
3.94%
1 jan 1971 ano
4.028
-0.004
-0.09%
1 jan 1972 ano
4.2
+0.172
4.26%
1 jan 1973 ano
4.244
+0.044
1.05%
1 jan 1974 ano
4.522
+0.278
6.54%
1 jan 1975 ano
5.862
+1.341
29.65%
1 jan 1976 ano
6.064
+0.201
3.43%
1 jan 1977 ano
6.237
+0.174
2.86%
1 jan 1978 ano
5.112
-1.126
-18.05%
1 jan 1979 ano
5.067
-0.045
-0.87%
1 jan 1980 ano
4.074
-0.993
-19.6%
1 jan 1981 ano
3.958
-0.116
-2.85%
1 jan 1982 ano
4.96
+1.002
25.33%
1 jan 1983 ano
5.012
+0.052
1.05%
1 jan 1984 ano
5.682
+0.67
13.36%
1 jan 1985 ano
5.302
-0.379
-6.68%
1 jan 1986 ano
4.924
-0.379
-7.14%
1 jan 1987 ano
4.811
-0.113
-2.3%
1 jan 1988 ano
4.711
-0.099
-2.06%
1 jan 1989 ano
5.124
+0.413
8.77%
1 jan 1990 ano
5.804
+0.679
13.26%
1 jan 1991 ano
5.72
-0.084
-1.45%
1 jan 1992 ano
6.574
+0.854
14.93%
1 jan 1993 ano
7.13
+0.556
8.46%
1 jan 1994 ano
7.765
+0.635
8.91%
1 jan 1995 ano
7.977
+0.213
2.74%
1 jan 1996 ano
8.741
+0.764
9.58%
1 jan 1997 ano
9.181
+0.44
5.03%
1 jan 1998 ano
9.487
+0.307
3.34%
1 jan 1999 ano
9.555
+0.067
0.71%
1 jan 2000 ano
9.953
+0.398
4.17%
1 jan 2001 ano
11.085
+1.132
11.37%
1 jan 2002 ano
11.689
+0.604
5.45%
1 jan 2003 ano
13.199
+1.51
12.92%
1 jan 2004 ano
14.927
+1.728
13.09%
1 jan 2005 ano
16.957
+2.03
13.6%
1 jan 2006 ano
18.61
+1.653
9.75%
1 jan 2007 ano
20.581
+1.971
10.59%
1 jan 2008 ano
21.645
+1.064
5.17%
1 jan 2009 ano
22.99
+1.345
6.21%
1 jan 2010 ano
24.458
+1.468
6.39%
1 jan 2011 ano
26.069
+1.611
6.59%
1 jan 2012 ano
27.009
+0.939
3.6%
1 jan 2013 ano
27.354
+0.345
1.28%
1 jan 2014 ano
26.201
-1.153
-4.21%
1 jan 2015 ano
25.215
-0.986
-3.76%
Classificação de países por estatísticas atuais por anos


Comentários: