29
/fr/
fr
AIzaSyAYiBZKx7MnpbEhh9jyipgxe19OcubqV5w
April 1, 2024
72283
Aruba
ABW
true
2
1
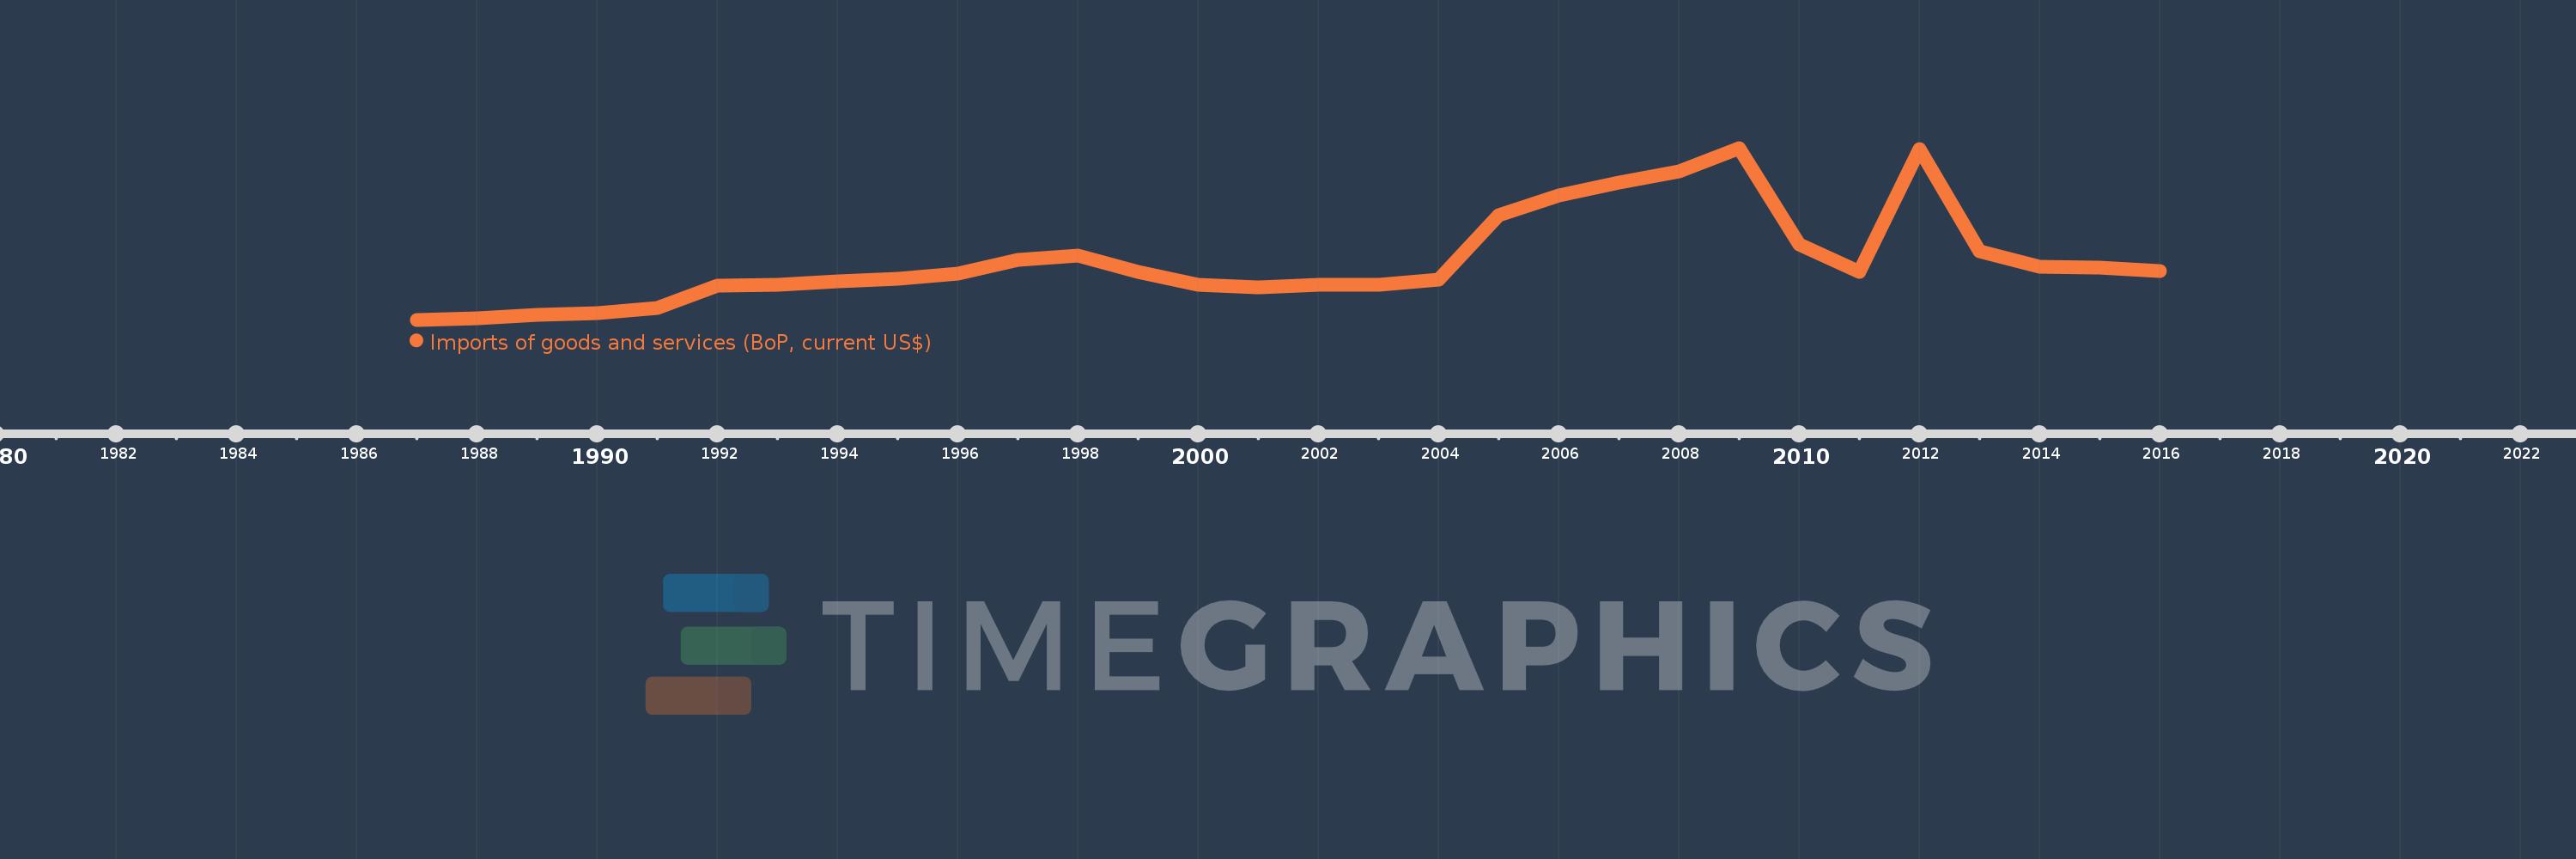
Imports of goods and services (BoP, current US$)
2016,2015,2014,2013,2012,2011,2010,2009,2008,2007,2006,2005,2004,2003,2002,2001,2000,1999,1998,1997,1996,1995,1994,1993,1992,1991,1990,1989,1988,1987
Cette statistique dans les autres pays:
AfghanistanAlbaniaAlgeriaAngolaAntigua and BarbudaArab WorldArgentinaArmeniaArubaAustraliaAustriaAzerbaijanBahamas, TheBahrainBangladeshBarbadosBelarusBelgiumBelizeBeninBermudaBhutanBoliviaBosnia and HerzegovinaBotswanaBrazilBrunei DarussalamBulgariaBurkina FasoBurundiCabo VerdeCambodiaCameroonCanadaCaribbean small statesCentral African RepublicCentral Europe and the BalticsChadChileChinaColombiaComorosCongo, Dem. Rep.Congo, Rep.Costa RicaCote d'IvoireCroatiaCuracaoCyprusCzech RepublicDenmarkDjiboutiDominicaDominican RepublicEarly-demographic dividendEast Asia & PacificEast Asia & Pacific (excluding high income)East Asia & Pacific (IDA & IBRD countries)EcuadorEgypt, Arab Rep.El SalvadorEquatorial GuineaEritreaEstoniaEthiopiaEuro areaEurope & Central AsiaEurope & Central Asia (excluding high income)Europe & Central Asia (IDA & IBRD countries)European UnionFaroe IslandsFijiFinlandFragile and conflict affected situationsFranceFrench PolynesiaGabonGambia, TheGeorgiaGermanyGhanaGreeceGrenadaGuatemalaGuineaGuinea-BissauGuyanaHaitiHeavily indebted poor countries (HIPC)High incomeHondurasHong Kong SAR, ChinaHungaryIBRD onlyIcelandIDA & IBRD totalIDA blendIDA onlyIDA totalIndiaIndonesiaIran, Islamic Rep.IraqIrelandIsraelItalyJamaicaJapanJordanKazakhstanKenyaKiribatiKorea, Rep.KosovoKuwaitKyrgyz RepublicLao PDRLate-demographic dividendLatin America & Caribbean Latin America & Caribbean (excluding high income)Latin America & the Caribbean (IDA & IBRD countries)LatviaLeast developed countries: UN classificationLebanonLesothoLiberiaLibyaLithuaniaLow & middle incomeLow incomeLower middle incomeLuxembourgMacao SAR, ChinaMacedonia, FYRMadagascarMalawiMalaysiaMaldivesMaliMaltaMarshall IslandsMauritaniaMauritiusMexicoMicronesia, Fed. Sts.Middle East & North Africa (excluding high income)Middle East & North Africa (IDA & IBRD countries)Middle incomeMoldovaMongoliaMontenegroMoroccoMozambiqueMyanmarNamibiaNepalNetherlandsNew CaledoniaNicaraguaNigerNigeriaNorth AmericaNorwayOECD membersOmanOther small statesPacific island small statesPakistanPalauPanamaPapua New GuineaParaguayPeruPhilippinesPolandPortugalPost-demographic dividendPre-demographic dividendQatarRomaniaRussian FederationRwandaSamoaSao Tome and PrincipeSaudi ArabiaSenegalSerbiaSeychellesSierra LeoneSingaporeSint Maarten (Dutch part)Slovak RepublicSloveniaSmall statesSolomon IslandsSouth AfricaSouth AsiaSouth Asia (IDA & IBRD)South SudanSpainSri LankaSt. Kitts and NevisSt. LuciaSt. Vincent and the GrenadinesSub-Saharan Africa Sub-Saharan Africa (excluding high income)Sub-Saharan Africa (IDA & IBRD countries)SudanSurinameSwazilandSwedenSwitzerlandSyrian Arab RepublicTajikistanTanzaniaThailandTimor-LesteTogoTongaTrinidad and TobagoTunisiaTurkeyTuvaluUgandaUkraineUnited KingdomUnited StatesUpper middle incomeUruguayVanuatuVenezuela, RBVietnamWest Bank and GazaWorldYemen, Rep.ZambiaZimbabwe La ligne de temps
Cette échelle de temps montre un graphique de 1987 année à 2016 année Aruba. Les données jusqu'à 1986 année ne sont pas présentés. Quantité d'observations actuelles selon dates: 30.
Source (désignation):
Les indicateurs du développement mondiale
Source (organisation):
International Monetary Fund, Balance of Payments Statistics Yearbook and data files.
Catégories:
Economy & Growth, Trade
Dernière mise à jour
23 avr. 2017
Les indicateurs de changement de valeurs selon les années
Minimum:
261.006 mln.
1 janv. 1987
Maximum:
6.812 mds
1 janv. 2009
Pour la date d''observation
Valeur
Changement absolu
Le changement par rapport à la valeur précédente
1 janv. 1987
261.006 mln.
+261.006 mln.
0.0%
1 janv. 1988
312.626 mln.
+51.62 mln.
19.78%
1 janv. 1989
439.888 mln.
+127.263 mln.
40.71%
1 janv. 1990
497.598 mln.
+57.709 mln.
13.12%
1 janv. 1991
715.754 mln.
+218.156 mln.
43.84%
1 janv. 1992
1.551 mds
+834.916 mln.
116.65%
1 janv. 1993
1.607 mds
+55.866 mln.
3.6%
1 janv. 1994
1.716 mds
+109.05 mln.
6.79%
1 janv. 1995
1.836 mds
+120.391 mln.
7.02%
1 janv. 1996
2.018 mds
+181.955 mln.
9.91%
1 janv. 1997
2.559 mds
+541.285 mln.
26.82%
1 janv. 1998
2.712 mds
+152.737 mln.
5.97%
1 janv. 1999
2.071 mds
-640.726 mln.
-23.63%
1 janv. 2000
1.59 mds
-480.983 mln.
-23.22%
1 janv. 2001
1.506 mds
-84.402 mln.
-5.31%
1 janv. 2002
1.588 mds
+81.905 mln.
5.44%
1 janv. 2003
1.587 mds
-1.229 mln.
-0.08%
1 janv. 2004
1.791 mds
+204.0 mln.
12.86%
1 janv. 2005
4.234 mds
+2.444 mds
136.49%
1 janv. 2006
5.008 mds
+773.532 mln.
18.27%
1 janv. 2007
5.48 mds
+471.627 mln.
9.42%
1 janv. 2008
5.911 mds
+431.919 mln.
7.88%
1 janv. 2009
6.812 mds
+900.447 mln.
15.23%
1 janv. 2010
3.146 mds
-3.666 mds
-53.82%
1 janv. 2011
2.074 mds
-1.072 mds
-34.08%
1 janv. 2012
6.76 mds
+4.687 mds
226.01%
1 janv. 2013
2.869 mds
-3.891 mds
-57.55%
1 janv. 2014
2.269 mds
-600.335 mln.
-20.92%
1 janv. 2015
2.262 mds
-6.704 mln.
-0.3%
1 janv. 2016
2.134 mds
-128.268 mln.
-5.67%
Classement des pays selon les statistiques actuelles par années


Commentaires: