29
/fr/
fr
AIzaSyAYiBZKx7MnpbEhh9jyipgxe19OcubqV5w
April 1, 2024
68917
Antigua and Barbuda
ATG
true
2
1
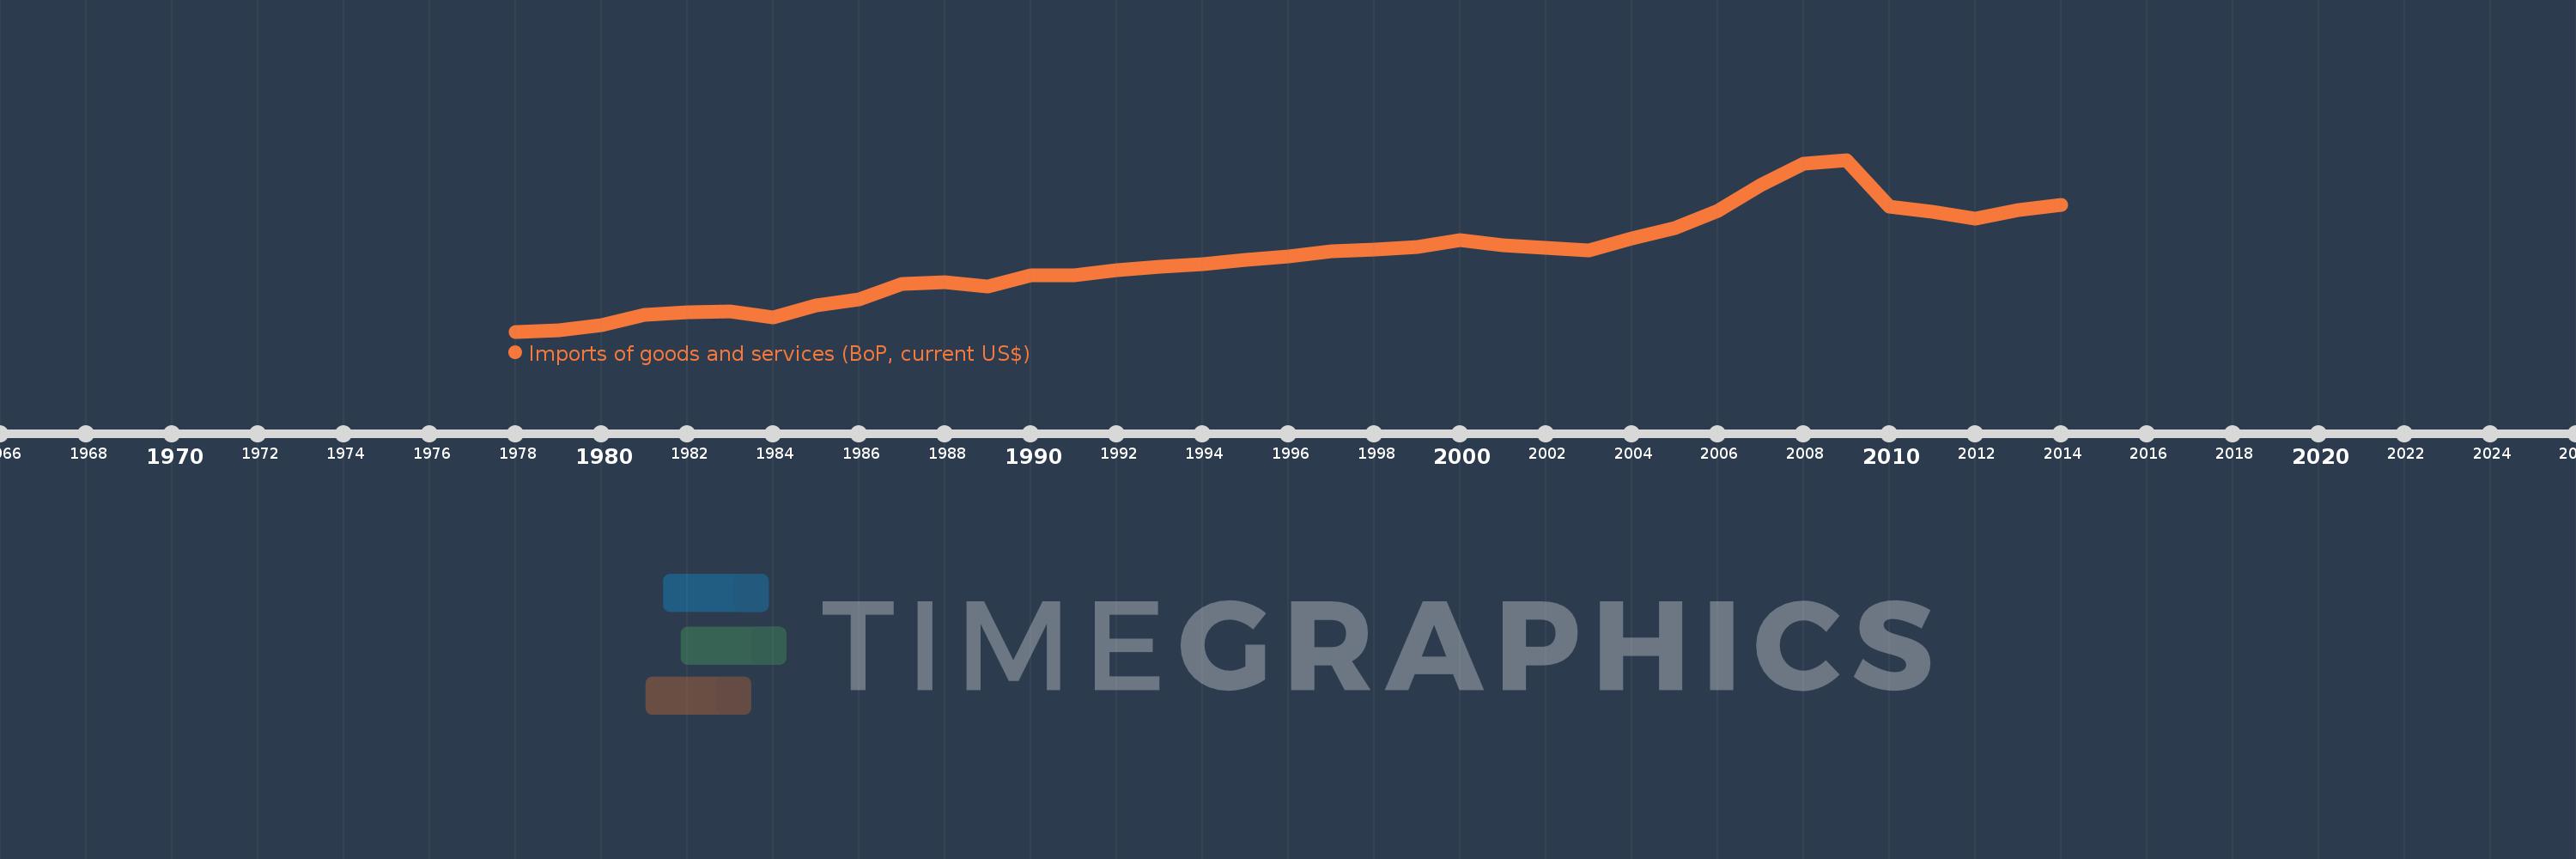
Imports of goods and services (BoP, current US$)
2014,2013,2012,2011,2010,2009,2008,2007,2006,2005,2004,2003,2002,2001,2000,1999,1998,1997,1996,1995,1994,1993,1992,1991,1990,1989,1988,1987,1986,1985,1984,1983,1982,1981,1980,1979,1978
Cette statistique dans les autres pays:
AfghanistanAlbaniaAlgeriaAngolaAntigua and BarbudaArab WorldArgentinaArmeniaArubaAustraliaAustriaAzerbaijanBahamas, TheBahrainBangladeshBarbadosBelarusBelgiumBelizeBeninBermudaBhutanBoliviaBosnia and HerzegovinaBotswanaBrazilBrunei DarussalamBulgariaBurkina FasoBurundiCabo VerdeCambodiaCameroonCanadaCaribbean small statesCentral African RepublicCentral Europe and the BalticsChadChileChinaColombiaComorosCongo, Dem. Rep.Congo, Rep.Costa RicaCote d'IvoireCroatiaCuracaoCyprusCzech RepublicDenmarkDjiboutiDominicaDominican RepublicEarly-demographic dividendEast Asia & PacificEast Asia & Pacific (excluding high income)East Asia & Pacific (IDA & IBRD countries)EcuadorEgypt, Arab Rep.El SalvadorEquatorial GuineaEritreaEstoniaEthiopiaEuro areaEurope & Central AsiaEurope & Central Asia (excluding high income)Europe & Central Asia (IDA & IBRD countries)European UnionFaroe IslandsFijiFinlandFragile and conflict affected situationsFranceFrench PolynesiaGabonGambia, TheGeorgiaGermanyGhanaGreeceGrenadaGuatemalaGuineaGuinea-BissauGuyanaHaitiHeavily indebted poor countries (HIPC)High incomeHondurasHong Kong SAR, ChinaHungaryIBRD onlyIcelandIDA & IBRD totalIDA blendIDA onlyIDA totalIndiaIndonesiaIran, Islamic Rep.IraqIrelandIsraelItalyJamaicaJapanJordanKazakhstanKenyaKiribatiKorea, Rep.KosovoKuwaitKyrgyz RepublicLao PDRLate-demographic dividendLatin America & Caribbean Latin America & Caribbean (excluding high income)Latin America & the Caribbean (IDA & IBRD countries)LatviaLeast developed countries: UN classificationLebanonLesothoLiberiaLibyaLithuaniaLow & middle incomeLow incomeLower middle incomeLuxembourgMacao SAR, ChinaMacedonia, FYRMadagascarMalawiMalaysiaMaldivesMaliMaltaMarshall IslandsMauritaniaMauritiusMexicoMicronesia, Fed. Sts.Middle East & North Africa (excluding high income)Middle East & North Africa (IDA & IBRD countries)Middle incomeMoldovaMongoliaMontenegroMoroccoMozambiqueMyanmarNamibiaNepalNetherlandsNew CaledoniaNicaraguaNigerNigeriaNorth AmericaNorwayOECD membersOmanOther small statesPacific island small statesPakistanPalauPanamaPapua New GuineaParaguayPeruPhilippinesPolandPortugalPost-demographic dividendPre-demographic dividendQatarRomaniaRussian FederationRwandaSamoaSao Tome and PrincipeSaudi ArabiaSenegalSerbiaSeychellesSierra LeoneSingaporeSint Maarten (Dutch part)Slovak RepublicSloveniaSmall statesSolomon IslandsSouth AfricaSouth AsiaSouth Asia (IDA & IBRD)South SudanSpainSri LankaSt. Kitts and NevisSt. LuciaSt. Vincent and the GrenadinesSub-Saharan Africa Sub-Saharan Africa (excluding high income)Sub-Saharan Africa (IDA & IBRD countries)SudanSurinameSwazilandSwedenSwitzerlandSyrian Arab RepublicTajikistanTanzaniaThailandTimor-LesteTogoTongaTrinidad and TobagoTunisiaTurkeyTuvaluUgandaUkraineUnited KingdomUnited StatesUpper middle incomeUruguayVanuatuVenezuela, RBVietnamWest Bank and GazaWorldYemen, Rep.ZambiaZimbabwe La ligne de temps
Cette échelle de temps montre un graphique de 1978 année à 2014 année Antigua and Barbuda. Les données jusqu'à 1977 année ne sont pas présentés. Quantité d'observations actuelles selon dates: 37.
Source (désignation):
Les indicateurs du développement mondiale
Source (organisation):
International Monetary Fund, Balance of Payments Statistics Yearbook and data files.
Catégories:
Economy & Growth, Trade
Dernière mise à jour
23 avr. 2017
Les indicateurs de changement de valeurs selon les années
Minimum:
43.5 mln.
1 janv. 1978
Maximum:
952.208 mln.
1 janv. 2009
Pour la date d''observation
Valeur
Changement absolu
Le changement par rapport à la valeur précédente
1 janv. 1978
43.5 mln.
+43.5 mln.
0.0%
1 janv. 1979
49.1 mln.
+5.6 mln.
12.87%
1 janv. 1980
78.0 mln.
+28.9 mln.
58.86%
1 janv. 1981
131.8 mln.
+53.8 mln.
68.97%
1 janv. 1982
145.0 mln.
+13.2 mln.
10.02%
1 janv. 1983
148.3 mln.
+3.3 mln.
2.28%
1 janv. 1984
118.0 mln.
-30.3 mln.
-20.43%
1 janv. 1985
180.8 mln.
+62.8 mln.
53.22%
1 janv. 1986
213.2 mln.
+32.4 mln.
17.92%
1 janv. 1987
293.537 mln.
+80.337 mln.
37.68%
1 janv. 1988
303.144 mln.
+9.607 mln.
3.27%
1 janv. 1989
283.8 mln.
-19.344 mln.
-6.38%
1 janv. 1990
338.911 mln.
+55.111 mln.
19.42%
1 janv. 1991
340.559 mln.
+1.648 mln.
0.49%
1 janv. 1992
369.889 mln.
+29.33 mln.
8.61%
1 janv. 1993
386.456 mln.
+16.567 mln.
4.48%
1 janv. 1994
398.5 mln.
+12.044 mln.
3.12%
1 janv. 1995
421.926 mln.
+23.426 mln.
5.88%
1 janv. 1996
438.926 mln.
+17.0 mln.
4.03%
1 janv. 1997
467.367 mln.
+28.441 mln.
6.48%
1 janv. 1998
478.289 mln.
+10.922 mln.
2.34%
1 janv. 1999
489.922 mln.
+11.633 mln.
2.43%
1 janv. 2000
529.322 mln.
+39.4 mln.
8.04%
1 janv. 2001
498.462 mln.
-30.861 mln.
-5.83%
1 janv. 2002
486.573 mln.
-11.889 mln.
-2.39%
1 janv. 2003
474.44 mln.
-12.133 mln.
-2.49%
1 janv. 2004
534.751 mln.
+60.312 mln.
12.71%
1 janv. 2005
592.338 mln.
+57.587 mln.
10.77%
1 janv. 2006
682.721 mln.
+90.382 mln.
15.26%
1 janv. 2007
818.413 mln.
+135.693 mln.
19.88%
1 janv. 2008
932.372 mln.
+113.959 mln.
13.92%
1 janv. 2009
952.208 mln.
+19.836 mln.
2.13%
1 janv. 2010
706.477 mln.
-245.731 mln.
-25.81%
1 janv. 2011
678.93 mln.
-27.547 mln.
-3.9%
1 janv. 2012
641.644 mln.
-37.286 mln.
-5.49%
1 janv. 2013
687.627 mln.
+45.983 mln.
7.17%
1 janv. 2014
713.899 mln.
+26.272 mln.
3.82%
Classement des pays selon les statistiques actuelles par années


Commentaires: