29
/fr/
fr
AIzaSyAYiBZKx7MnpbEhh9jyipgxe19OcubqV5w
April 1, 2024
39079
IDA only
IDX
false
2
1
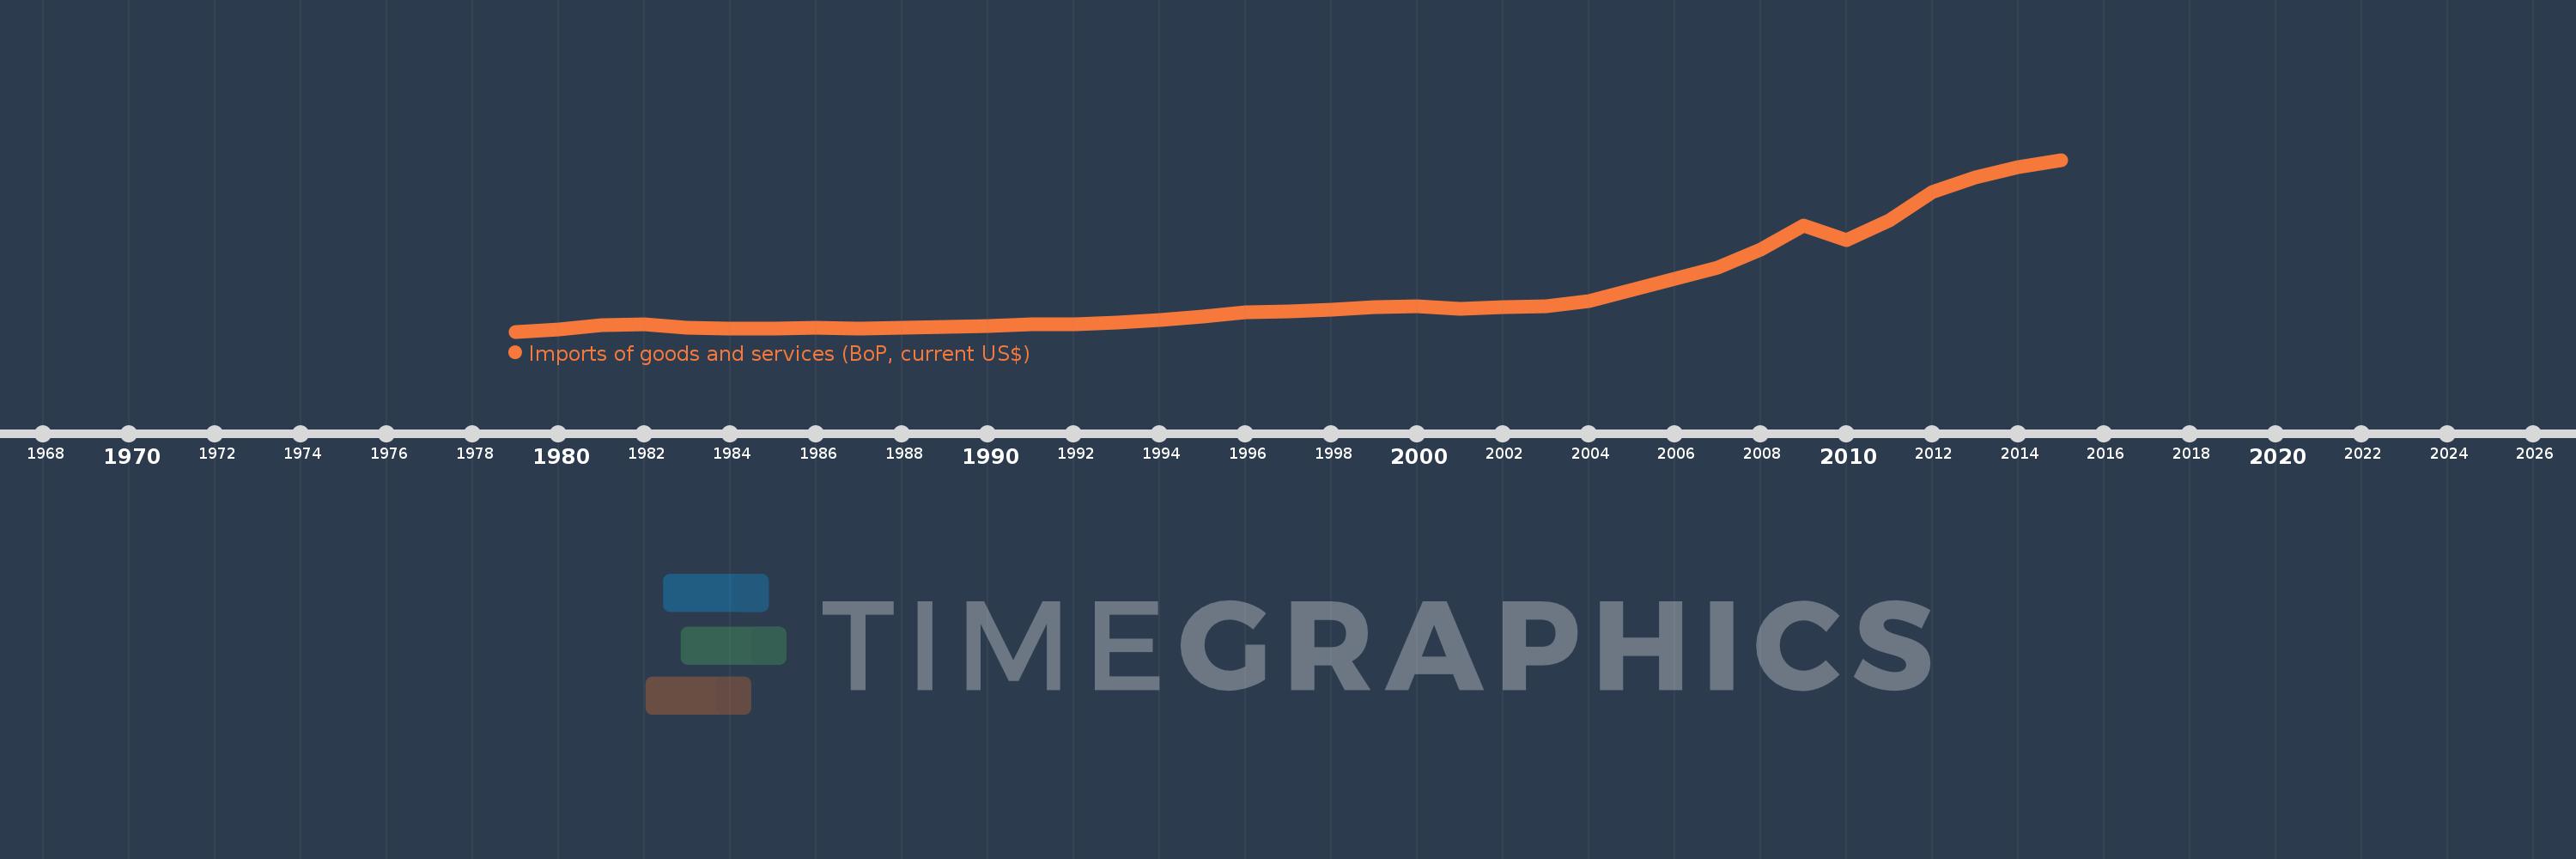
Imports of goods and services (BoP, current US$)
2015,2014,2013,2012,2011,2010,2009,2008,2007,2006,2005,2004,2003,2002,2001,2000,1999,1998,1997,1996,1995,1994,1993,1992,1991,1990,1989,1988,1987,1986,1985,1984,1983,1982,1981,1980,1979
Cette statistique dans les autres pays:
AfghanistanAlbaniaAlgeriaAngolaAntigua and BarbudaArab WorldArgentinaArmeniaArubaAustraliaAustriaAzerbaijanBahamas, TheBahrainBangladeshBarbadosBelarusBelgiumBelizeBeninBermudaBhutanBoliviaBosnia and HerzegovinaBotswanaBrazilBrunei DarussalamBulgariaBurkina FasoBurundiCabo VerdeCambodiaCameroonCanadaCaribbean small statesCentral African RepublicCentral Europe and the BalticsChadChileChinaColombiaComorosCongo, Dem. Rep.Congo, Rep.Costa RicaCote d'IvoireCroatiaCuracaoCyprusCzech RepublicDenmarkDjiboutiDominicaDominican RepublicEarly-demographic dividendEast Asia & PacificEast Asia & Pacific (excluding high income)East Asia & Pacific (IDA & IBRD countries)EcuadorEgypt, Arab Rep.El SalvadorEquatorial GuineaEritreaEstoniaEthiopiaEuro areaEurope & Central AsiaEurope & Central Asia (excluding high income)Europe & Central Asia (IDA & IBRD countries)European UnionFaroe IslandsFijiFinlandFragile and conflict affected situationsFranceFrench PolynesiaGabonGambia, TheGeorgiaGermanyGhanaGreeceGrenadaGuatemalaGuineaGuinea-BissauGuyanaHaitiHeavily indebted poor countries (HIPC)High incomeHondurasHong Kong SAR, ChinaHungaryIBRD onlyIcelandIDA & IBRD totalIDA blendIDA onlyIDA totalIndiaIndonesiaIran, Islamic Rep.IraqIrelandIsraelItalyJamaicaJapanJordanKazakhstanKenyaKiribatiKorea, Rep.KosovoKuwaitKyrgyz RepublicLao PDRLate-demographic dividendLatin America & Caribbean Latin America & Caribbean (excluding high income)Latin America & the Caribbean (IDA & IBRD countries)LatviaLeast developed countries: UN classificationLebanonLesothoLiberiaLibyaLithuaniaLow & middle incomeLow incomeLower middle incomeLuxembourgMacao SAR, ChinaMacedonia, FYRMadagascarMalawiMalaysiaMaldivesMaliMaltaMarshall IslandsMauritaniaMauritiusMexicoMicronesia, Fed. Sts.Middle East & North Africa (excluding high income)Middle East & North Africa (IDA & IBRD countries)Middle incomeMoldovaMongoliaMontenegroMoroccoMozambiqueMyanmarNamibiaNepalNetherlandsNew CaledoniaNicaraguaNigerNigeriaNorth AmericaNorwayOECD membersOmanOther small statesPacific island small statesPakistanPalauPanamaPapua New GuineaParaguayPeruPhilippinesPolandPortugalPost-demographic dividendPre-demographic dividendQatarRomaniaRussian FederationRwandaSamoaSao Tome and PrincipeSaudi ArabiaSenegalSerbiaSeychellesSierra LeoneSingaporeSint Maarten (Dutch part)Slovak RepublicSloveniaSmall statesSolomon IslandsSouth AfricaSouth AsiaSouth Asia (IDA & IBRD)South SudanSpainSri LankaSt. Kitts and NevisSt. LuciaSt. Vincent and the GrenadinesSub-Saharan Africa Sub-Saharan Africa (excluding high income)Sub-Saharan Africa (IDA & IBRD countries)SudanSurinameSwazilandSwedenSwitzerlandSyrian Arab RepublicTajikistanTanzaniaThailandTimor-LesteTogoTongaTrinidad and TobagoTunisiaTurkeyTuvaluUgandaUkraineUnited KingdomUnited StatesUpper middle incomeUruguayVanuatuVenezuela, RBVietnamWest Bank and GazaWorldYemen, Rep.ZambiaZimbabwe La ligne de temps
Cette échelle de temps montre un graphique de 1979 année à 2015 année IDA only. Les données jusqu'à 1978 année ne sont pas présentés. Quantité d'observations actuelles selon dates: 37.
Source (désignation):
Les indicateurs du développement mondiale
Source (organisation):
International Monetary Fund, Balance of Payments Statistics Yearbook and data files.
Catégories:
Economy & Growth, Trade
Dernière mise à jour
23 avr. 2017
Les indicateurs de changement de valeurs selon les années
Minimum:
29.027 mds
1 janv. 1979
Maximum:
387.356 mds
1 janv. 2015
Pour la date d''observation
Valeur
Changement absolu
Le changement par rapport à la valeur précédente
1 janv. 1979
29.027 mds
+29.027 mds
0.0%
1 janv. 1980
33.808 mds
+4.781 mds
16.47%
1 janv. 1981
42.736 mds
+8.927 mds
26.41%
1 janv. 1982
43.704 mds
+968.013 mln.
2.27%
1 janv. 1983
37.545 mds
-6.159 mds
-14.09%
1 janv. 1984
35.192 mds
-2.353 mds
-6.27%
1 janv. 1985
35.415 mds
+223.801 mln.
0.64%
1 janv. 1986
36.381 mds
+965.037 mln.
2.72%
1 janv. 1987
35.741 mds
-639.629 mln.
-1.76%
1 janv. 1988
37.691 mds
+1.95 mds
5.46%
1 janv. 1989
39.61 mds
+1.92 mds
5.09%
1 janv. 1990
40.677 mds
+1.066 mds
2.69%
1 janv. 1991
44.875 mds
+4.199 mds
10.32%
1 janv. 1992
44.543 mds
-332.635 mln.
-0.74%
1 janv. 1993
47.577 mds
+3.035 mds
6.81%
1 janv. 1994
53.92 mds
+6.342 mds
13.33%
1 janv. 1995
60.448 mds
+6.528 mds
12.11%
1 janv. 1996
68.852 mds
+8.404 mds
13.9%
1 janv. 1997
71.538 mds
+2.686 mds
3.9%
1 janv. 1998
74.034 mds
+2.496 mds
3.49%
1 janv. 1999
79.204 mds
+5.17 mds
6.98%
1 janv. 2000
81.242 mds
+2.037 mds
2.57%
1 janv. 2001
76.775 mds
-4.467 mds
-5.5%
1 janv. 2002
80.167 mds
+3.392 mds
4.42%
1 janv. 2003
81.855 mds
+1.689 mds
2.11%
1 janv. 2004
93.351 mds
+11.495 mds
14.04%
1 janv. 2005
115.821 mds
+22.47 mds
24.07%
1 janv. 2006
139.599 mds
+23.779 mds
20.53%
1 janv. 2007
162.806 mds
+23.206 mds
16.62%
1 janv. 2008
200.11 mds
+37.304 mds
22.91%
1 janv. 2009
249.499 mds
+49.389 mds
24.68%
1 janv. 2010
220.375 mds
-29.124 mds
-11.67%
1 janv. 2011
261.468 mds
+41.092 mds
18.65%
1 janv. 2012
320.507 mds
+59.039 mds
22.58%
1 janv. 2013
350.264 mds
+29.757 mds
9.28%
1 janv. 2014
372.485 mds
+22.222 mds
6.34%
1 janv. 2015
387.356 mds
+14.871 mds
3.99%
Classement des pays selon les statistiques actuelles par années


Commentaires: