29
/fr/
fr
AIzaSyAYiBZKx7MnpbEhh9jyipgxe19OcubqV5w
April 1, 2024
140512
Ghana
GHA
true
2
1
Imports of goods and services (BoP, current US$)
2016,2015,2014,2013,2012,2011,2010,2009,2008,2007,2006,2005,2004,2003,2002,2001,2000,1999,1998,1997,1996,1995,1994,1993,1992,1991,1990,1989,1988,1987,1986,1985,1984,1983,1982,1981,1980,1979,1978,1977,1976
Cette statistique dans les autres pays:
AfghanistanAlbaniaAlgeriaAngolaAntigua and BarbudaArab WorldArgentinaArmeniaArubaAustraliaAustriaAzerbaijanBahamas, TheBahrainBangladeshBarbadosBelarusBelgiumBelizeBeninBermudaBhutanBoliviaBosnia and HerzegovinaBotswanaBrazilBrunei DarussalamBulgariaBurkina FasoBurundiCabo VerdeCambodiaCameroonCanadaCaribbean small statesCentral African RepublicCentral Europe and the BalticsChadChileChinaColombiaComorosCongo, Dem. Rep.Congo, Rep.Costa RicaCote d'IvoireCroatiaCuracaoCyprusCzech RepublicDenmarkDjiboutiDominicaDominican RepublicEarly-demographic dividendEast Asia & PacificEast Asia & Pacific (excluding high income)East Asia & Pacific (IDA & IBRD countries)EcuadorEgypt, Arab Rep.El SalvadorEquatorial GuineaEritreaEstoniaEthiopiaEuro areaEurope & Central AsiaEurope & Central Asia (excluding high income)Europe & Central Asia (IDA & IBRD countries)European UnionFaroe IslandsFijiFinlandFragile and conflict affected situationsFranceFrench PolynesiaGabonGambia, TheGeorgiaGermanyGhanaGreeceGrenadaGuatemalaGuineaGuinea-BissauGuyanaHaitiHeavily indebted poor countries (HIPC)High incomeHondurasHong Kong SAR, ChinaHungaryIBRD onlyIcelandIDA & IBRD totalIDA blendIDA onlyIDA totalIndiaIndonesiaIran, Islamic Rep.IraqIrelandIsraelItalyJamaicaJapanJordanKazakhstanKenyaKiribatiKorea, Rep.KosovoKuwaitKyrgyz RepublicLao PDRLate-demographic dividendLatin America & Caribbean Latin America & Caribbean (excluding high income)Latin America & the Caribbean (IDA & IBRD countries)LatviaLeast developed countries: UN classificationLebanonLesothoLiberiaLibyaLithuaniaLow & middle incomeLow incomeLower middle incomeLuxembourgMacao SAR, ChinaMacedonia, FYRMadagascarMalawiMalaysiaMaldivesMaliMaltaMarshall IslandsMauritaniaMauritiusMexicoMicronesia, Fed. Sts.Middle East & North Africa (excluding high income)Middle East & North Africa (IDA & IBRD countries)Middle incomeMoldovaMongoliaMontenegroMoroccoMozambiqueMyanmarNamibiaNepalNetherlandsNew CaledoniaNicaraguaNigerNigeriaNorth AmericaNorwayOECD membersOmanOther small statesPacific island small statesPakistanPalauPanamaPapua New GuineaParaguayPeruPhilippinesPolandPortugalPost-demographic dividendPre-demographic dividendQatarRomaniaRussian FederationRwandaSamoaSao Tome and PrincipeSaudi ArabiaSenegalSerbiaSeychellesSierra LeoneSingaporeSint Maarten (Dutch part)Slovak RepublicSloveniaSmall statesSolomon IslandsSouth AfricaSouth AsiaSouth Asia (IDA & IBRD)South SudanSpainSri LankaSt. Kitts and NevisSt. LuciaSt. Vincent and the GrenadinesSub-Saharan Africa Sub-Saharan Africa (excluding high income)Sub-Saharan Africa (IDA & IBRD countries)SudanSurinameSwazilandSwedenSwitzerlandSyrian Arab RepublicTajikistanTanzaniaThailandTimor-LesteTogoTongaTrinidad and TobagoTunisiaTurkeyTuvaluUgandaUkraineUnited KingdomUnited StatesUpper middle incomeUruguayVanuatuVenezuela, RBVietnamWest Bank and GazaWorldYemen, Rep.ZambiaZimbabwe La ligne de temps
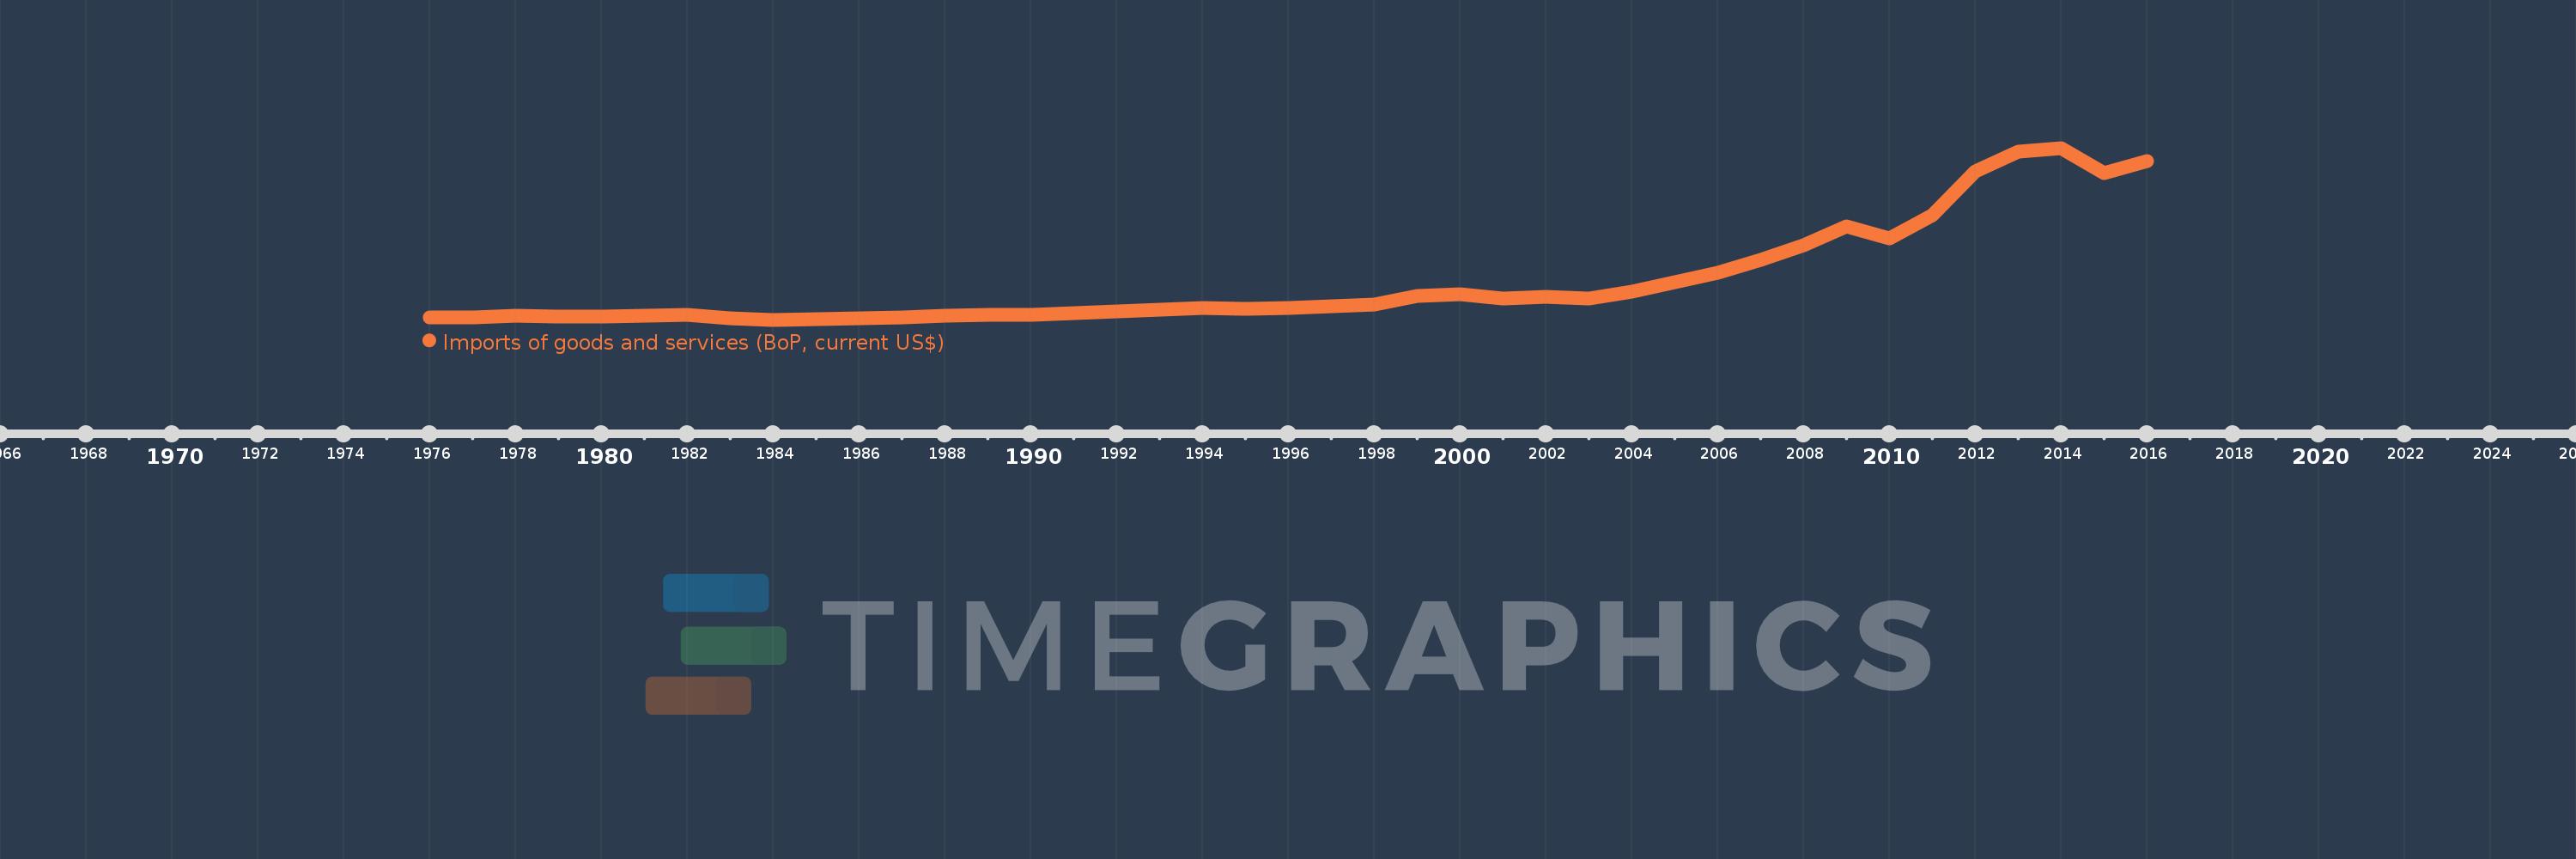
Cette échelle de temps montre un graphique de 1976 année à 2016 année Ghana. Les données jusqu'à 1975 année ne sont pas présentés. Quantité d'observations actuelles selon dates: 41.
Source (désignation):
Les indicateurs du développement mondiale
Source (organisation):
International Monetary Fund, Balance of Payments Statistics Yearbook and data files.
Catégories:
Economy & Growth, Trade
Dernière mise à jour
23 avr. 2017
Les indicateurs de changement de valeurs selon les années
Minimum:
634.4 mln.
1 janv. 1984
Maximum:
22.498 mds
1 janv. 2014
Pour la date d''observation
Valeur
Changement absolu
Le changement par rapport à la valeur précédente
1 janv. 1976
881.57 mln.
+881.57 mln.
0.0%
1 janv. 1977
950.527 mln.
+68.957 mln.
7.82%
1 janv. 1978
1.121 mds
+170.696 mln.
17.96%
1 janv. 1979
1.073 mds
-48.342 mln.
-4.31%
1 janv. 1980
1.064 mds
-8.843 mln.
-0.82%
1 janv. 1981
1.178 mds
+114.163 mln.
10.73%
1 janv. 1982
1.25 mds
+71.4 mln.
6.06%
1 janv. 1983
816.9 mln.
-432.7 mln.
-34.63%
1 janv. 1984
634.4 mln.
-182.5 mln.
-22.34%
1 janv. 1985
696.0 mln.
+61.6 mln.
9.71%
1 janv. 1986
836.4 mln.
+140.4 mln.
20.17%
1 janv. 1987
975.85 mln.
+139.45 mln.
16.67%
1 janv. 1988
1.201 mds
+224.95 mln.
23.05%
1 janv. 1989
1.261 mds
+60.6 mln.
5.05%
1 janv. 1990
1.288 mds
+26.1 mln.
2.07%
1 janv. 1991
1.506 mds
+218.0 mln.
16.93%
1 janv. 1992
1.655 mds
+149.552 mln.
9.93%
1 janv. 1993
1.882 mds
+226.748 mln.
13.7%
1 janv. 1994
2.173 mds
+291.5 mln.
15.49%
1 janv. 1995
2.001 mds
-172.6 mln.
-7.94%
1 janv. 1996
2.119 mds
+118.8 mln.
5.94%
1 janv. 1997
2.375 mds
+255.95 mln.
12.08%
1 janv. 1998
2.612 mds
+236.974 mln.
9.98%
1 janv. 1999
3.651 mds
+1.039 mds
39.76%
1 janv. 2000
3.926 mds
+274.87 mln.
7.53%
1 janv. 2001
3.35 mds
-575.682 mln.
-14.66%
1 janv. 2002
3.575 mds
+224.312 mln.
6.7%
1 janv. 2003
3.328 mds
-246.599 mln.
-6.9%
1 janv. 2004
4.155 mds
+826.877 mln.
24.85%
1 janv. 2005
5.379 mds
+1.224 mds
29.47%
1 janv. 2006
6.62 mds
+1.241 mds
23.08%
1 janv. 2007
8.286 mds
+1.666 mds
25.17%
1 janv. 2008
10.065 mds
+1.778 mds
21.46%
1 janv. 2009
12.567 mds
+2.502 mds
24.86%
1 janv. 2010
10.989 mds
-1.577 mds
-12.55%
1 janv. 2011
13.925 mds
+2.936 mds
26.72%
1 janv. 2012
19.504 mds
+5.579 mds
40.06%
1 janv. 2013
21.999 mds
+2.495 mds
12.79%
1 janv. 2014
22.498 mds
+498.945 mln.
2.27%
1 janv. 2015
19.247 mds
-3.251 mds
-14.45%
1 janv. 2016
20.774 mds
+1.527 mds
7.93%
Classement des pays selon les statistiques actuelles par années


Commentaires: