29
/fr/
fr
AIzaSyAYiBZKx7MnpbEhh9jyipgxe19OcubqV5w
April 1, 2024
222312
Peru
PER
true
2
1
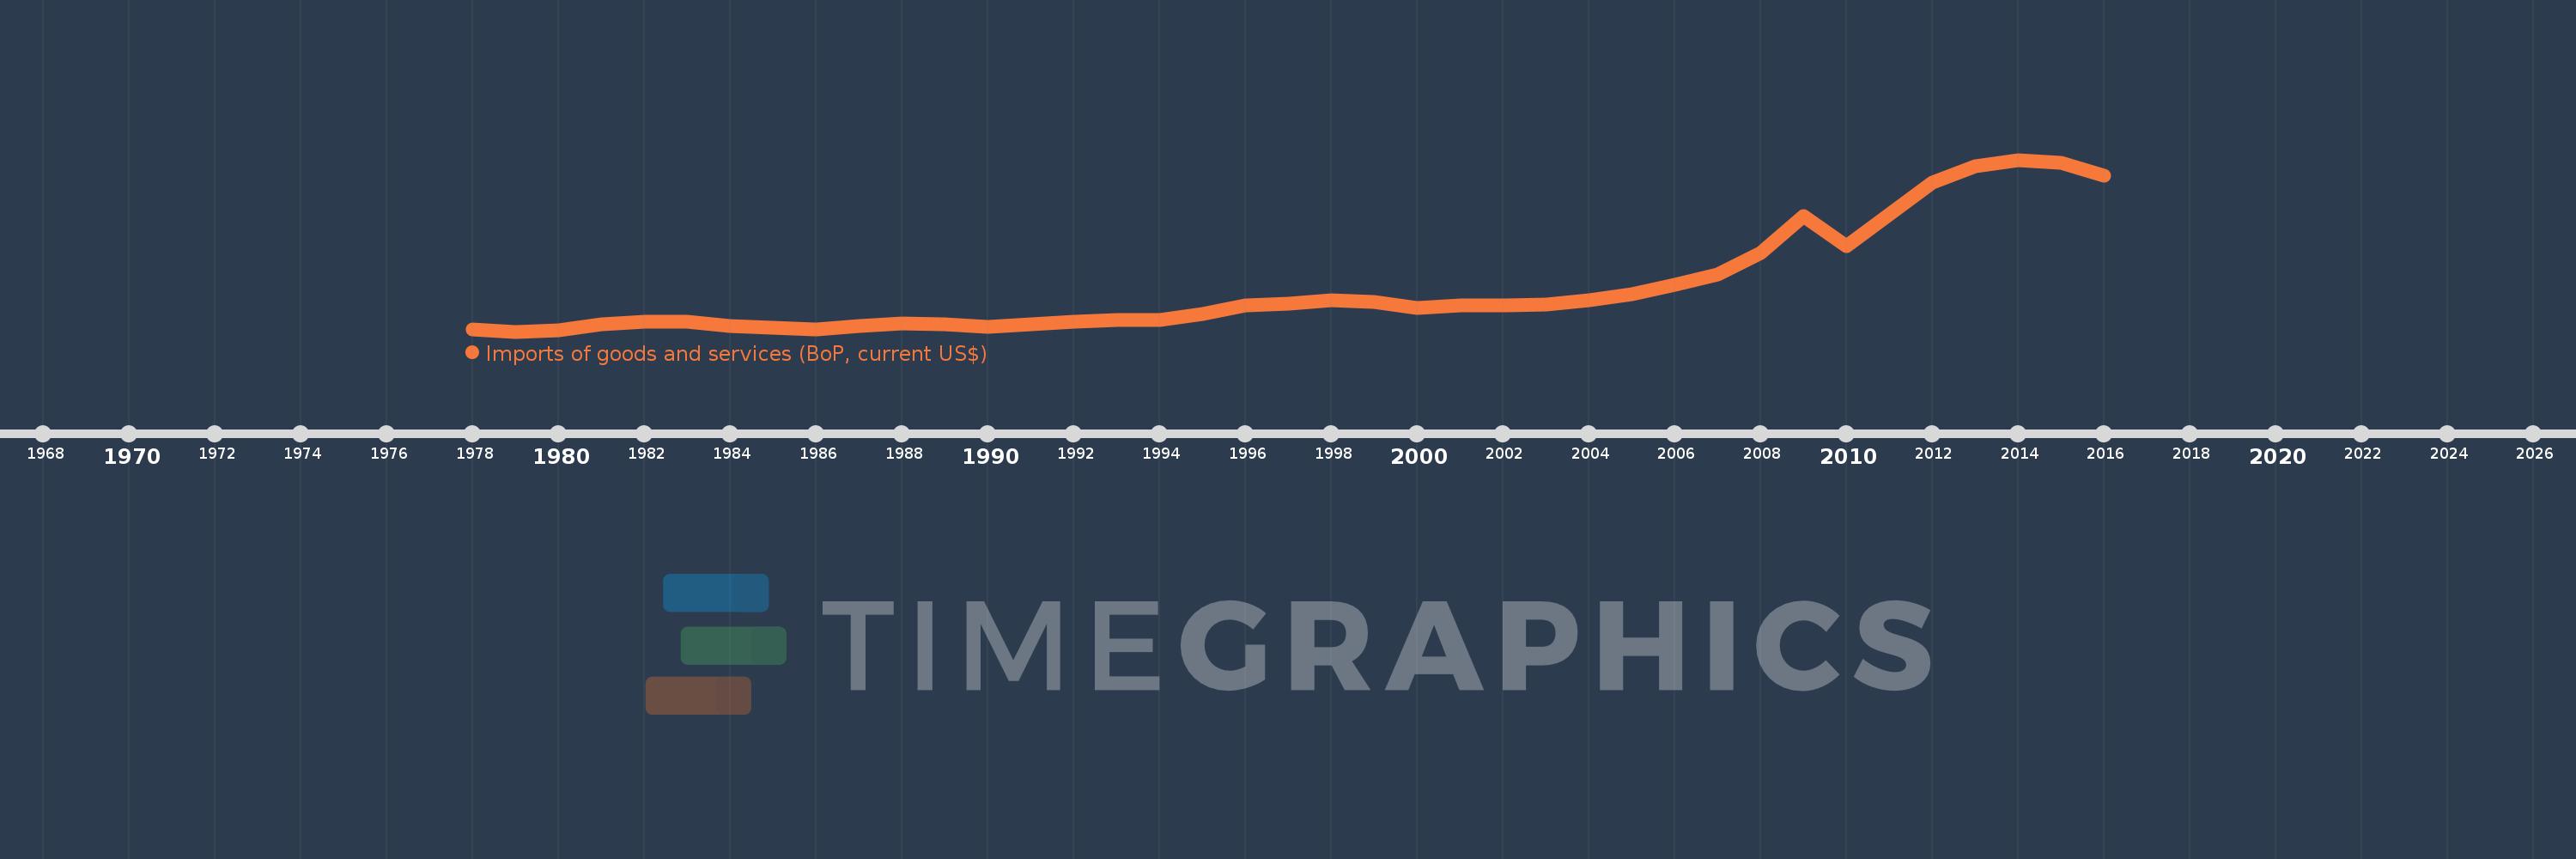
Imports of goods and services (BoP, current US$)
2016,2015,2014,2013,2012,2011,2010,2009,2008,2007,2006,2005,2004,2003,2002,2001,2000,1999,1998,1997,1996,1995,1994,1993,1992,1991,1990,1989,1988,1987,1986,1985,1984,1983,1982,1981,1980,1979,1978
Cette statistique dans les autres pays:
AfghanistanAlbaniaAlgeriaAngolaAntigua and BarbudaArab WorldArgentinaArmeniaArubaAustraliaAustriaAzerbaijanBahamas, TheBahrainBangladeshBarbadosBelarusBelgiumBelizeBeninBermudaBhutanBoliviaBosnia and HerzegovinaBotswanaBrazilBrunei DarussalamBulgariaBurkina FasoBurundiCabo VerdeCambodiaCameroonCanadaCaribbean small statesCentral African RepublicCentral Europe and the BalticsChadChileChinaColombiaComorosCongo, Dem. Rep.Congo, Rep.Costa RicaCote d'IvoireCroatiaCuracaoCyprusCzech RepublicDenmarkDjiboutiDominicaDominican RepublicEarly-demographic dividendEast Asia & PacificEast Asia & Pacific (excluding high income)East Asia & Pacific (IDA & IBRD countries)EcuadorEgypt, Arab Rep.El SalvadorEquatorial GuineaEritreaEstoniaEthiopiaEuro areaEurope & Central AsiaEurope & Central Asia (excluding high income)Europe & Central Asia (IDA & IBRD countries)European UnionFaroe IslandsFijiFinlandFragile and conflict affected situationsFranceFrench PolynesiaGabonGambia, TheGeorgiaGermanyGhanaGreeceGrenadaGuatemalaGuineaGuinea-BissauGuyanaHaitiHeavily indebted poor countries (HIPC)High incomeHondurasHong Kong SAR, ChinaHungaryIBRD onlyIcelandIDA & IBRD totalIDA blendIDA onlyIDA totalIndiaIndonesiaIran, Islamic Rep.IraqIrelandIsraelItalyJamaicaJapanJordanKazakhstanKenyaKiribatiKorea, Rep.KosovoKuwaitKyrgyz RepublicLao PDRLate-demographic dividendLatin America & Caribbean Latin America & Caribbean (excluding high income)Latin America & the Caribbean (IDA & IBRD countries)LatviaLeast developed countries: UN classificationLebanonLesothoLiberiaLibyaLithuaniaLow & middle incomeLow incomeLower middle incomeLuxembourgMacao SAR, ChinaMacedonia, FYRMadagascarMalawiMalaysiaMaldivesMaliMaltaMarshall IslandsMauritaniaMauritiusMexicoMicronesia, Fed. Sts.Middle East & North Africa (excluding high income)Middle East & North Africa (IDA & IBRD countries)Middle incomeMoldovaMongoliaMontenegroMoroccoMozambiqueMyanmarNamibiaNepalNetherlandsNew CaledoniaNicaraguaNigerNigeriaNorth AmericaNorwayOECD membersOmanOther small statesPacific island small statesPakistanPalauPanamaPapua New GuineaParaguayPeruPhilippinesPolandPortugalPost-demographic dividendPre-demographic dividendQatarRomaniaRussian FederationRwandaSamoaSao Tome and PrincipeSaudi ArabiaSenegalSerbiaSeychellesSierra LeoneSingaporeSint Maarten (Dutch part)Slovak RepublicSloveniaSmall statesSolomon IslandsSouth AfricaSouth AsiaSouth Asia (IDA & IBRD)South SudanSpainSri LankaSt. Kitts and NevisSt. LuciaSt. Vincent and the GrenadinesSub-Saharan Africa Sub-Saharan Africa (excluding high income)Sub-Saharan Africa (IDA & IBRD countries)SudanSurinameSwazilandSwedenSwitzerlandSyrian Arab RepublicTajikistanTanzaniaThailandTimor-LesteTogoTongaTrinidad and TobagoTunisiaTurkeyTuvaluUgandaUkraineUnited KingdomUnited StatesUpper middle incomeUruguayVanuatuVenezuela, RBVietnamWest Bank and GazaWorldYemen, Rep.ZambiaZimbabwe La ligne de temps
Cette échelle de temps montre un graphique de 1978 année à 2016 année Peru. Les données jusqu'à 1977 année ne sont pas présentés. Quantité d'observations actuelles selon dates: 39.
Source (désignation):
Les indicateurs du développement mondiale
Source (organisation):
International Monetary Fund, Balance of Payments Statistics Yearbook and data files.
Catégories:
Economy & Growth, Trade
Dernière mise à jour
23 avr. 2017
Les indicateurs de changement de valeurs selon les années
Minimum:
2.07 mds
1 janv. 1979
Maximum:
49.323 mds
1 janv. 2014
Pour la date d''observation
Valeur
Changement absolu
Le changement par rapport à la valeur précédente
1 janv. 1978
2.687 mds
+2.687 mds
0.0%
1 janv. 1979
2.07 mds
-617.1 mln.
-22.96%
1 janv. 1980
2.511 mds
+441.1 mln.
21.31%
1 janv. 1981
3.97 mds
+1.458 mds
58.08%
1 janv. 1982
4.889 mds
+919.3 mln.
23.16%
1 janv. 1983
4.819 mds
-70.0 mln.
-1.43%
1 janv. 1984
3.687 mds
-1.132 mds
-23.49%
1 janv. 1985
3.031 mds
-656.1 mln.
-17.79%
1 janv. 1986
2.764 mds
-266.9 mln.
-8.81%
1 janv. 1987
3.662 mds
+897.81 mln.
32.48%
1 janv. 1988
4.379 mds
+716.94 mln.
19.58%
1 janv. 1989
4.029 mds
-349.57 mln.
-7.98%
1 janv. 1990
3.43 mds
-599.59 mln.
-14.88%
1 janv. 1991
4.059 mds
+629.41 mln.
18.35%
1 janv. 1992
4.804 mds
+745.0 mln.
18.35%
1 janv. 1993
5.32 mds
+516.0 mln.
10.74%
1 janv. 1994
5.364 mds
+44.211 mln.
0.83%
1 janv. 1995
6.849 mds
+1.485 mds
27.67%
1 janv. 1996
9.298 mds
+2.449 mds
35.76%
1 janv. 1997
9.777 mds
+479.191 mln.
5.15%
1 janv. 1998
10.622 mds
+844.589 mln.
8.64%
1 janv. 1999
10.33 mds
-291.087 mln.
-2.74%
1 janv. 2000
8.667 mds
-1.663 mds
-16.1%
1 janv. 2001
9.342 mds
+675.487 mln.
7.79%
1 janv. 2002
9.298 mds
-44.394 mln.
-0.48%
1 janv. 2003
9.577 mds
+278.587 mln.
3.0%
1 janv. 2004
10.633 mds
+1.056 mds
11.03%
1 janv. 2005
12.316 mds
+1.683 mds
15.83%
1 janv. 2006
14.93 mds
+2.613 mds
21.22%
1 janv. 2007
17.877 mds
+2.947 mds
19.74%
1 janv. 2008
23.612 mds
+5.736 mds
32.09%
1 janv. 2009
33.793 mds
+10.181 mds
43.12%
1 janv. 2010
25.626 mds
-8.167 mds
-24.17%
1 janv. 2011
34.434 mds
+8.808 mds
34.37%
1 janv. 2012
42.961 mds
+8.527 mds
24.76%
1 janv. 2013
47.619 mds
+4.658 mds
10.84%
1 janv. 2014
49.323 mds
+1.704 mds
3.58%
1 janv. 2015
48.396 mds
-926.976 mln.
-1.88%
1 janv. 2016
44.979 mds
-3.417 mds
-7.06%
Classement des pays selon les statistiques actuelles par années


Commentaires: