29
/fr/
fr
AIzaSyAYiBZKx7MnpbEhh9jyipgxe19OcubqV5w
April 1, 2024
206879
Nepal
NPL
true
2
1
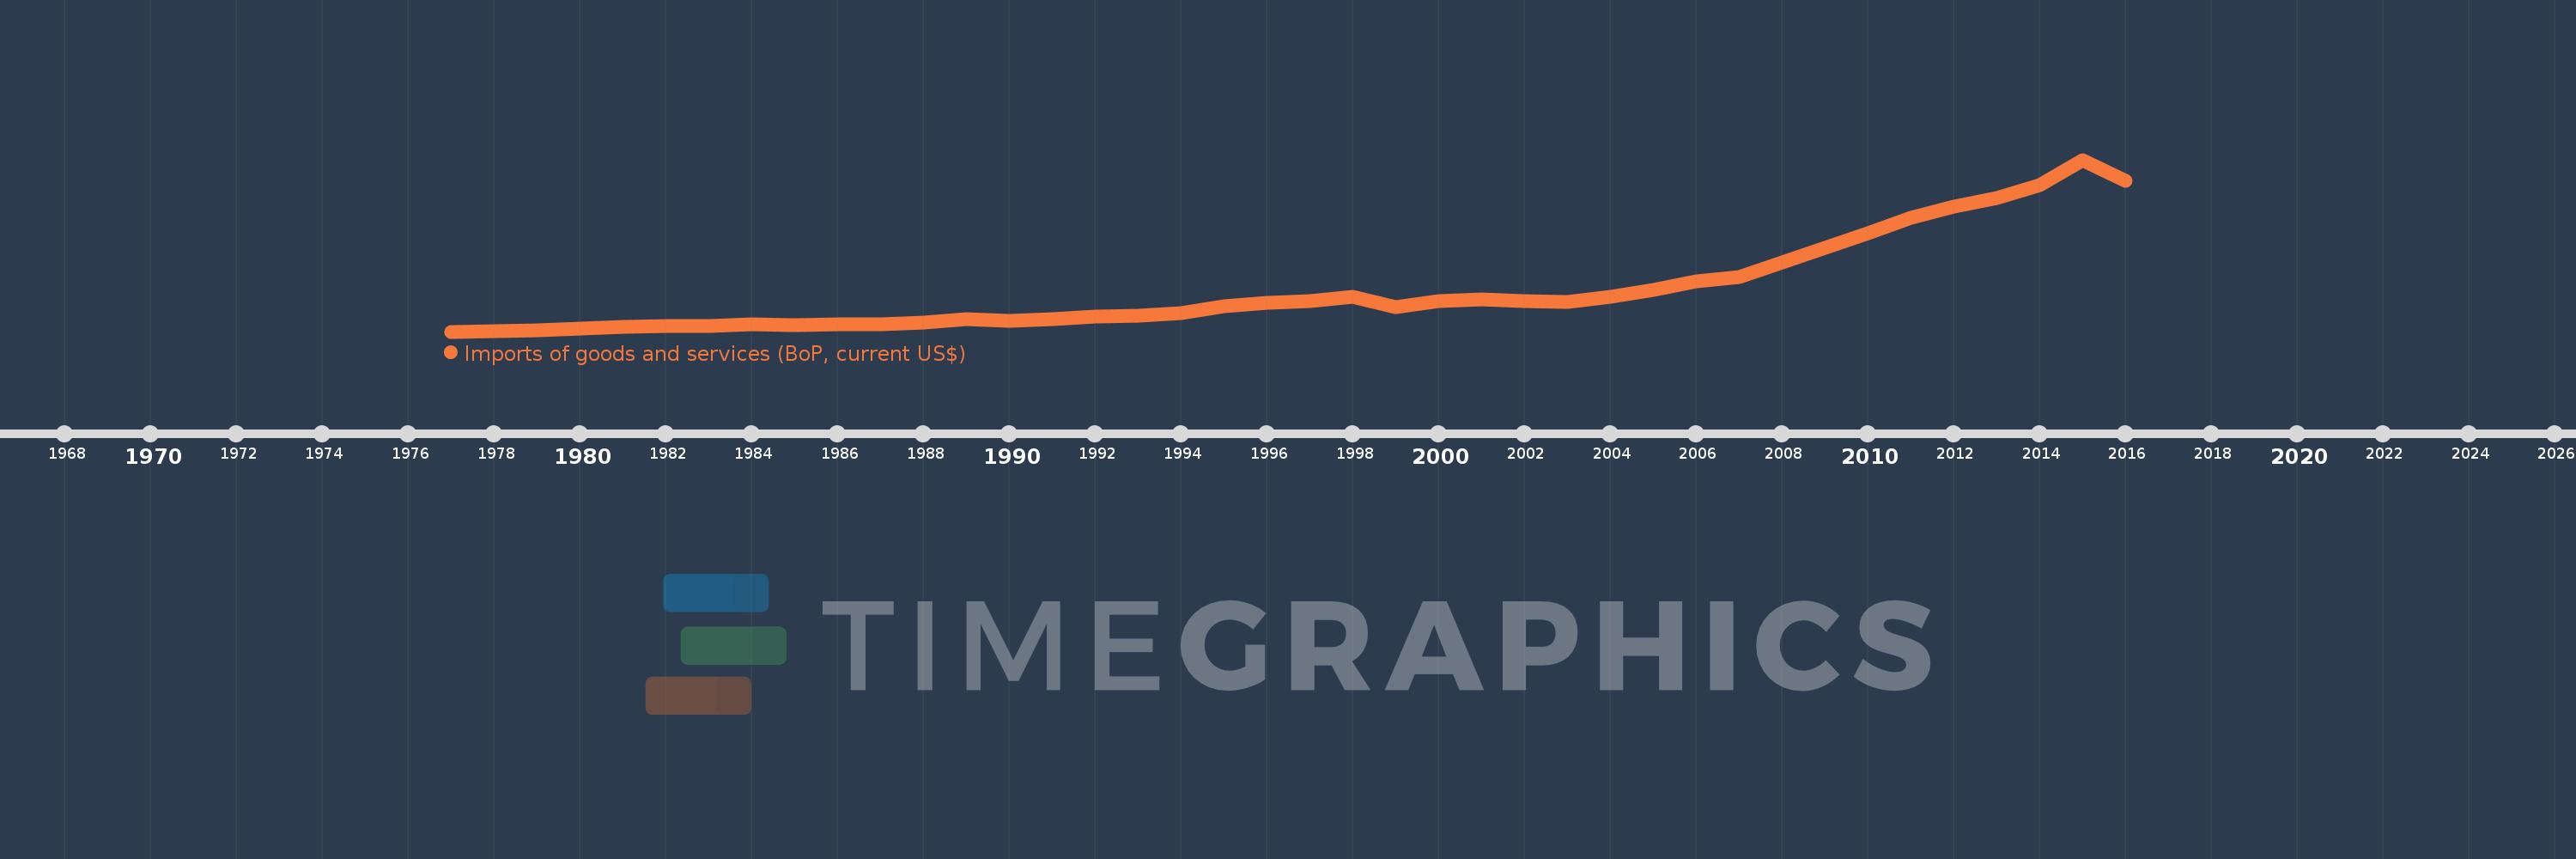
Imports of goods and services (BoP, current US$)
2016,2015,2014,2013,2012,2011,2010,2009,2008,2007,2006,2005,2004,2003,2002,2001,2000,1999,1998,1997,1996,1995,1994,1993,1992,1991,1990,1989,1988,1987,1986,1985,1984,1983,1982,1981,1980,1979,1978,1977
Cette statistique dans les autres pays:
AfghanistanAlbaniaAlgeriaAngolaAntigua and BarbudaArab WorldArgentinaArmeniaArubaAustraliaAustriaAzerbaijanBahamas, TheBahrainBangladeshBarbadosBelarusBelgiumBelizeBeninBermudaBhutanBoliviaBosnia and HerzegovinaBotswanaBrazilBrunei DarussalamBulgariaBurkina FasoBurundiCabo VerdeCambodiaCameroonCanadaCaribbean small statesCentral African RepublicCentral Europe and the BalticsChadChileChinaColombiaComorosCongo, Dem. Rep.Congo, Rep.Costa RicaCote d'IvoireCroatiaCuracaoCyprusCzech RepublicDenmarkDjiboutiDominicaDominican RepublicEarly-demographic dividendEast Asia & PacificEast Asia & Pacific (excluding high income)East Asia & Pacific (IDA & IBRD countries)EcuadorEgypt, Arab Rep.El SalvadorEquatorial GuineaEritreaEstoniaEthiopiaEuro areaEurope & Central AsiaEurope & Central Asia (excluding high income)Europe & Central Asia (IDA & IBRD countries)European UnionFaroe IslandsFijiFinlandFragile and conflict affected situationsFranceFrench PolynesiaGabonGambia, TheGeorgiaGermanyGhanaGreeceGrenadaGuatemalaGuineaGuinea-BissauGuyanaHaitiHeavily indebted poor countries (HIPC)High incomeHondurasHong Kong SAR, ChinaHungaryIBRD onlyIcelandIDA & IBRD totalIDA blendIDA onlyIDA totalIndiaIndonesiaIran, Islamic Rep.IraqIrelandIsraelItalyJamaicaJapanJordanKazakhstanKenyaKiribatiKorea, Rep.KosovoKuwaitKyrgyz RepublicLao PDRLate-demographic dividendLatin America & Caribbean Latin America & Caribbean (excluding high income)Latin America & the Caribbean (IDA & IBRD countries)LatviaLeast developed countries: UN classificationLebanonLesothoLiberiaLibyaLithuaniaLow & middle incomeLow incomeLower middle incomeLuxembourgMacao SAR, ChinaMacedonia, FYRMadagascarMalawiMalaysiaMaldivesMaliMaltaMarshall IslandsMauritaniaMauritiusMexicoMicronesia, Fed. Sts.Middle East & North Africa (excluding high income)Middle East & North Africa (IDA & IBRD countries)Middle incomeMoldovaMongoliaMontenegroMoroccoMozambiqueMyanmarNamibiaNepalNetherlandsNew CaledoniaNicaraguaNigerNigeriaNorth AmericaNorwayOECD membersOmanOther small statesPacific island small statesPakistanPalauPanamaPapua New GuineaParaguayPeruPhilippinesPolandPortugalPost-demographic dividendPre-demographic dividendQatarRomaniaRussian FederationRwandaSamoaSao Tome and PrincipeSaudi ArabiaSenegalSerbiaSeychellesSierra LeoneSingaporeSint Maarten (Dutch part)Slovak RepublicSloveniaSmall statesSolomon IslandsSouth AfricaSouth AsiaSouth Asia (IDA & IBRD)South SudanSpainSri LankaSt. Kitts and NevisSt. LuciaSt. Vincent and the GrenadinesSub-Saharan Africa Sub-Saharan Africa (excluding high income)Sub-Saharan Africa (IDA & IBRD countries)SudanSurinameSwazilandSwedenSwitzerlandSyrian Arab RepublicTajikistanTanzaniaThailandTimor-LesteTogoTongaTrinidad and TobagoTunisiaTurkeyTuvaluUgandaUkraineUnited KingdomUnited StatesUpper middle incomeUruguayVanuatuVenezuela, RBVietnamWest Bank and GazaWorldYemen, Rep.ZambiaZimbabwe La ligne de temps
Cette échelle de temps montre un graphique de 1977 année à 2016 année Nepal. Les données jusqu'à 1976 année ne sont pas présentés. Quantité d'observations actuelles selon dates: 40.
Source (désignation):
Les indicateurs du développement mondiale
Source (organisation):
International Monetary Fund, Balance of Payments Statistics Yearbook and data files.
Catégories:
Economy & Growth, Trade
Dernière mise à jour
23 avr. 2017
Les indicateurs de changement de valeurs selon les années
Minimum:
196.904 mln.
1 janv. 1977
Maximum:
8.778 mds
1 janv. 2015
Pour la date d''observation
Valeur
Changement absolu
Le changement par rapport à la valeur précédente
1 janv. 1977
196.904 mln.
+196.904 mln.
0.0%
1 janv. 1978
211.736 mln.
+14.832 mln.
7.53%
1 janv. 1979
277.619 mln.
+65.883 mln.
31.12%
1 janv. 1980
325.642 mln.
+48.023 mln.
17.3%
1 janv. 1981
415.65 mln.
+90.008 mln.
27.64%
1 janv. 1982
456.316 mln.
+40.666 mln.
9.78%
1 janv. 1983
491.482 mln.
+35.166 mln.
7.71%
1 janv. 1984
556.244 mln.
+64.763 mln.
13.18%
1 janv. 1985
502.43 mln.
-53.814 mln.
-9.67%
1 janv. 1986
559.743 mln.
+57.312 mln.
11.41%
1 janv. 1987
550.164 mln.
-9.578 mln.
-1.71%
1 janv. 1988
643.607 mln.
+93.443 mln.
16.98%
1 janv. 1989
815.685 mln.
+172.078 mln.
26.74%
1 janv. 1990
715.84 mln.
-99.845 mln.
-12.24%
1 janv. 1991
833.937 mln.
+118.097 mln.
16.5%
1 janv. 1992
940.82 mln.
+106.883 mln.
12.82%
1 janv. 1993
977.065 mln.
+36.245 mln.
3.85%
1 janv. 1994
1.11 mds
+133.328 mln.
13.65%
1 janv. 1995
1.456 mds
+345.148 mln.
31.08%
1 janv. 1996
1.624 mds
+168.57 mln.
11.58%
1 janv. 1997
1.737 mds
+113.383 mln.
6.98%
1 janv. 1998
1.916 mds
+178.924 mln.
10.3%
1 janv. 1999
1.435 mds
-481.147 mln.
-25.11%
1 janv. 2000
1.707 mds
+271.349 mln.
18.91%
1 janv. 2001
1.79 mds
+83.433 mln.
4.89%
1 janv. 2002
1.7 mds
-89.608 mln.
-5.01%
1 janv. 2003
1.662 mds
-38.278 mln.
-2.25%
1 janv. 2004
1.932 mds
+269.955 mln.
16.24%
1 janv. 2005
2.293 mds
+360.886 mln.
18.68%
1 janv. 2006
2.711 mds
+418.183 mln.
18.24%
1 janv. 2007
2.934 mds
+222.672 mln.
8.21%
1 janv. 2008
3.655 mds
+721.298 mln.
24.59%
1 janv. 2009
4.371 mds
+715.926 mln.
19.59%
1 janv. 2010
5.101 mds
+729.964 mln.
16.7%
1 janv. 2011
5.879 mds
+777.796 mln.
15.25%
1 janv. 2012
6.447 mds
+568.386 mln.
9.67%
1 janv. 2013
6.847 mds
+400.197 mln.
6.21%
1 janv. 2014
7.528 mds
+680.14 mln.
9.93%
1 janv. 2015
8.778 mds
+1.25 mds
16.61%
1 janv. 2016
7.712 mds
-1.066 mds
-12.15%
Classement des pays selon les statistiques actuelles par années


Commentaires: